European equities softened on Wednesday as risk appetite wanes, but DAX holds on
- European stocks mostly saw declines on Wednesday.
- Major indexes added to recent declines despite DAX holding steady for the day.
- Rate cut expectancy from the ECB is getting readjusted, easing investor appetite.

European major stock equities largely saw declines on Wednesday, driven lower as markets readjust their bets on the pace of rate cuts from the European Central Bank (ECB). The European Unemployment Rate continues to hold relatively steady, printing at 6.4% in November compared to the previous 6.5%, and the lack of declining employment is chipping away at odds of a faster pace of rate cuts from the ECB.
ECB policymaker reaffirmed their current stance on rate hikes, noting that a technical session could be hiding behind the data, but market hopes for rate declines could have run too far ahead of what central banks are prepared to deliver at this time.
With rate cut hopes fading, European equities are facing overall declines, with the pan-European EUROSTOXX 600 equity index declining nearly a fifth of a percent, falling 0.84 points to close at €476.42. France’s CAC 40 slipped a scant 0.01%, falling half a point to €7.426.08, while Germany’s DAX 40 held relatively steady, stepping up a slim 0.01%, closing up 1.45 points at €16,689.81.
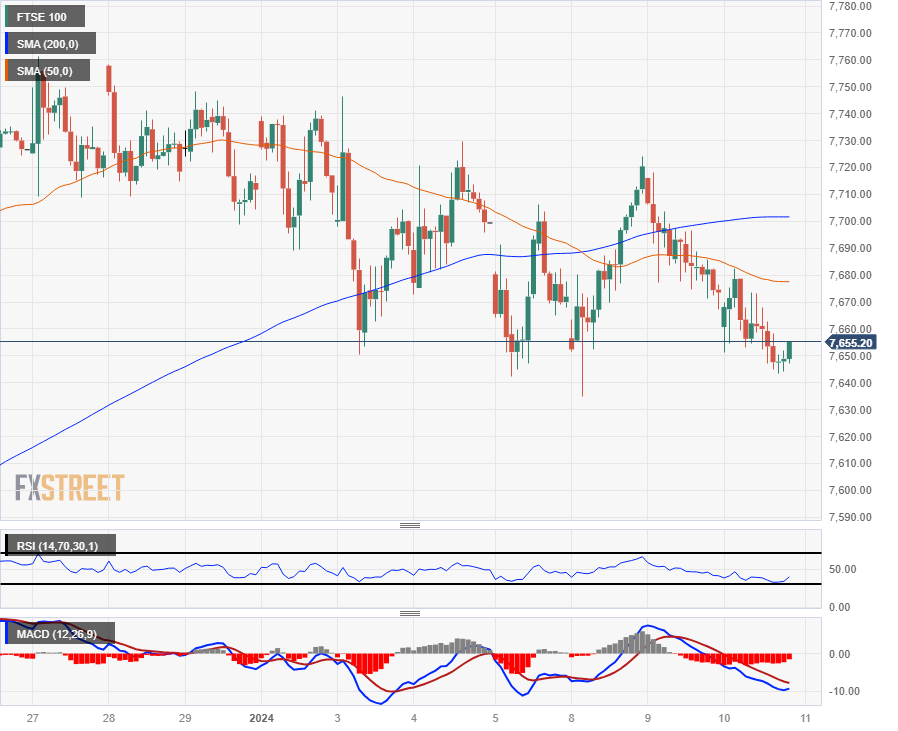
Meanwhile, London’s FTSE 100 major equity index fell 32.2 points to close down 0.42% at £7,651.76.
FTSE Technical Outlook
The FTSE 100 fell 0.51% peak-to-trough on Wednesday, getting knocked back into near-term lows as the index corkscrews through technical barriers at the 50-hour and 200-hour Simple Moving Averages (SMA), with the longer moving average rotating into a flat stance near £7,700.
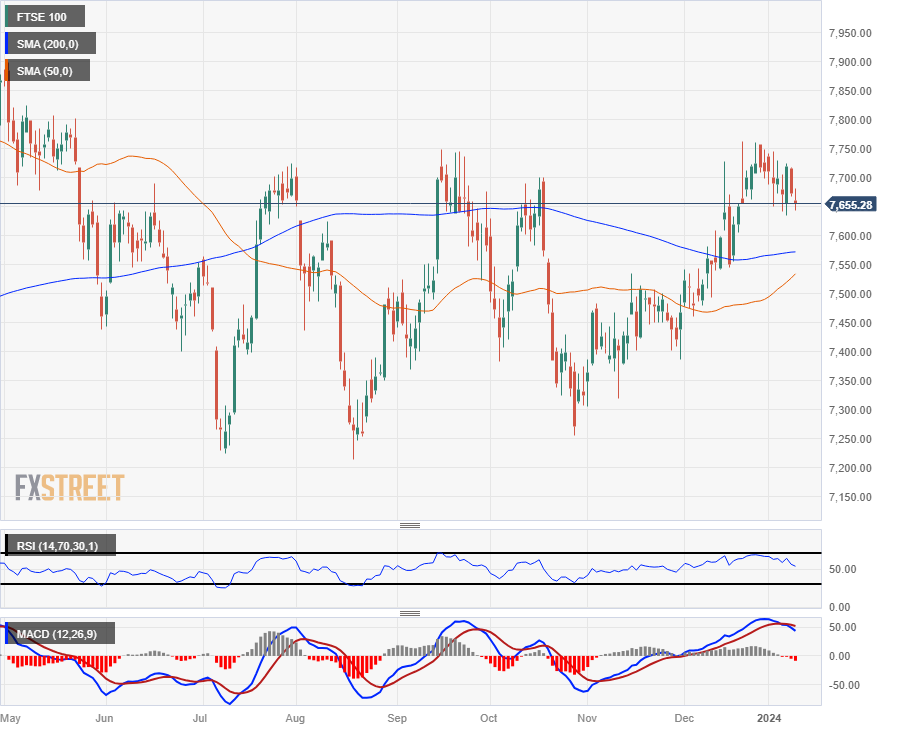
Despite near-term downside pressure, the FTSE 100 has managed to hold onto bullish territory, trading north of the 200-day SMA near £7,575, and London’s leading equity index is up 5.5% from last October’s low bids near £7,255.70.
FTSE Hourly Chart
FTSE Daily Chart
FTSE Technical Levels
Author

Joshua Gibson
FXStreet
Joshua joins the FXStreet team as an Economics and Finance double major from Vancouver Island University with twelve years' experience as an independent trader focusing on technical analysis.















