EUR/USD trying to hold on, gripping 1.0730
- The EUR/USD took a stepdown in early Tuesday trading, and bidders are looking to recover.
- US and EU economic data in the mid-week to complicate the charts.
- ECB rate call is around the corner, alongside US inflation figures due.

The EUR/USD pairing is determined to restore balance on Tuesday and is pushing into 1.0735 in afternoon trading after sliding to the day’s lows near 1.0705.
The Euro (EUR) is on the low end against the Greenback (USD) for the day, down from Tuesday’s opening prices near 1.0747, and down even further from the day’s early peak of 1.0770.
The tug-of-war is likely to continue in the short term as the mid-week sees a healthy economic calendar, with both the US and the Eurozone (EU) represented on the data docket for Wednesday and Thursday.
US, EU data in the pipe
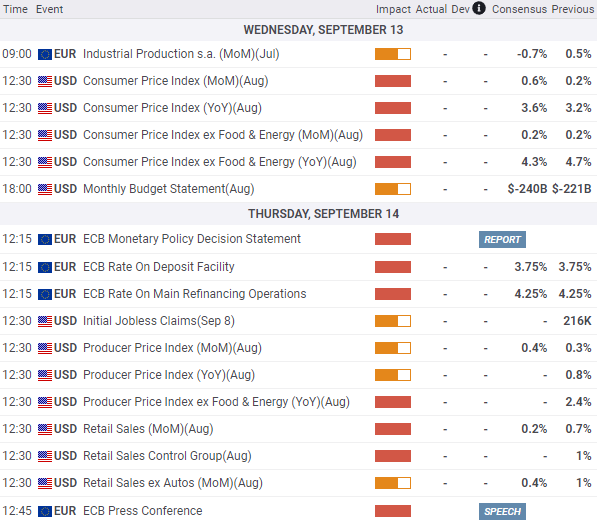
Wednesday’s economic calendar sees US Consumer Price Index (CPI) figures as well as the federal government’s Monthly Budget Statement. Market analysts broadly expect US headline CPI for August to tick upwards to 0.6%, an increase from the previous month’s 0.2%. August’s Core CPI (CPI less food and energy costs) meanwhile is forecast to hold steady at 0.2% from the previous month’s reading.
The US federal budget deficit for the month of August is also expected to backslide, down $240 billion compared to the previous month’s $221 billion deficit.
Thursday will see the European Central Bank (ECB) giving its latest rate announcement; investors are expecting the ECB to hold steady on interest rates, though recent hawkish comments from ECB officials have seen an uptick in the number of market participants expecting an additional rate increase.
Thirty minutes after the ECB rate call there will be a press conference with ECB officials, where investors will be listening closely for any hints about the path forward for the European central bank’s interest rate policy.
Thursday also brings US Producer Price Index (PPI) figures, as well as Retail Sales. The monthly PPI for August is expected to tick upwards, albeit slightly, from 0.3% to 0.4%. Meanwhile, Retail Sales growth is expected to decline to 0.2% from July’s 0.7%. While a positive figure, but a contraction in growth figures could signal a softening economy, and market participants will be keeping a close eye on the print.
EUR/USD economic calendar for Wednesday and Thursday; all times in GMT.
EUR/USD technical outlook
The Euro got knocked lower against the USD in early Tuesday trading after an initial climb up the charts, and the pair is struggling to build meaningful momentum from the 100-hour Simple Moving Average (SMA). The hourly MACD histogram indicator is beginning to rotate bullish, with the fast-moving average gearing up to swap places with the indicator line.
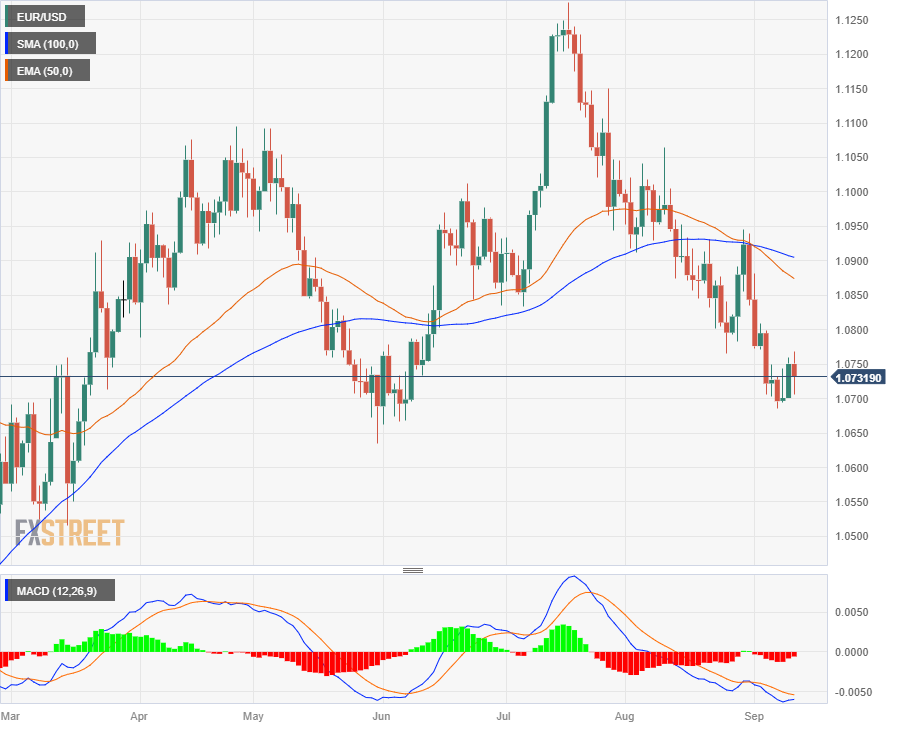
The EUR/USD has closed in the red for the past eight consecutive weeks, and buyers will be looking to reverse the pair’s recent rejection from the 100-day SMA, which has gone flat and is threatening to turn bearish. A bearish inversion of the 100-day SMA and 50-day Exponential Moving Average (EMA) is likewise complicating bidding efforts.
Meanwhile, the MACD on daily candlesticks is showing oversold conditions, though the slow line histogram of the MACD is showing further room for the EUR/USD to stoop even lower in the event of a failed bid to re-establish bullish momentum.
EUR/USD daily chart
EUR/USD technical levels
Author

Joshua Gibson
FXStreet
Joshua joins the FXStreet team as an Economics and Finance double major from Vancouver Island University with twelve years' experience as an independent trader focusing on technical analysis.


