EUR/USD: the battle for 1.2500 ahead of FOMC
- The market is pricing in a rate hike on Wednesday at the FOMC meeting.
- The 1.2500 level has been a major pivotal level over many decades.

The EUR/USD is trading at around 1.2346 up 0.47% as ECB members considered likely that the QE program might end at the end of this year and additionally they seemed comfortable with market´s estimations of a rate increase by Q2 of 2019.
According to Westpac analysts: “We find that the USD is undervalued, both on narrow and broader measures and regardless of the look back period, but the caution is that the USD’s undervaluation has not “ripened” in either magnitude or duration”. Find more information here.
EUR/USD monthly chart

The striking feature of the monthly chart of the EUR/USD is the confluence of factors at the 1.2500 level. The 100 and 200-period simple moving averages are converging and very close to the 1.2500 level. The 61.8% Fibonacci retracement from the 2014-2015 downtrend is seen also seen at 1.2598. Additionally, the 1.2000-1.2500 has been a major support and resistance zones for many decades. From a technical point that is a lot of resistance to go through. Will the bulls have what it takes? Looking at the 2017-2018 bull run, the bears have almost been nonexistent with very short-lived corrections. The RSI and MACD show no signs of exhaustion. So all-in-all the trend is healthy so far with strong resistance at 1.2500.
EUR/USD daily chart
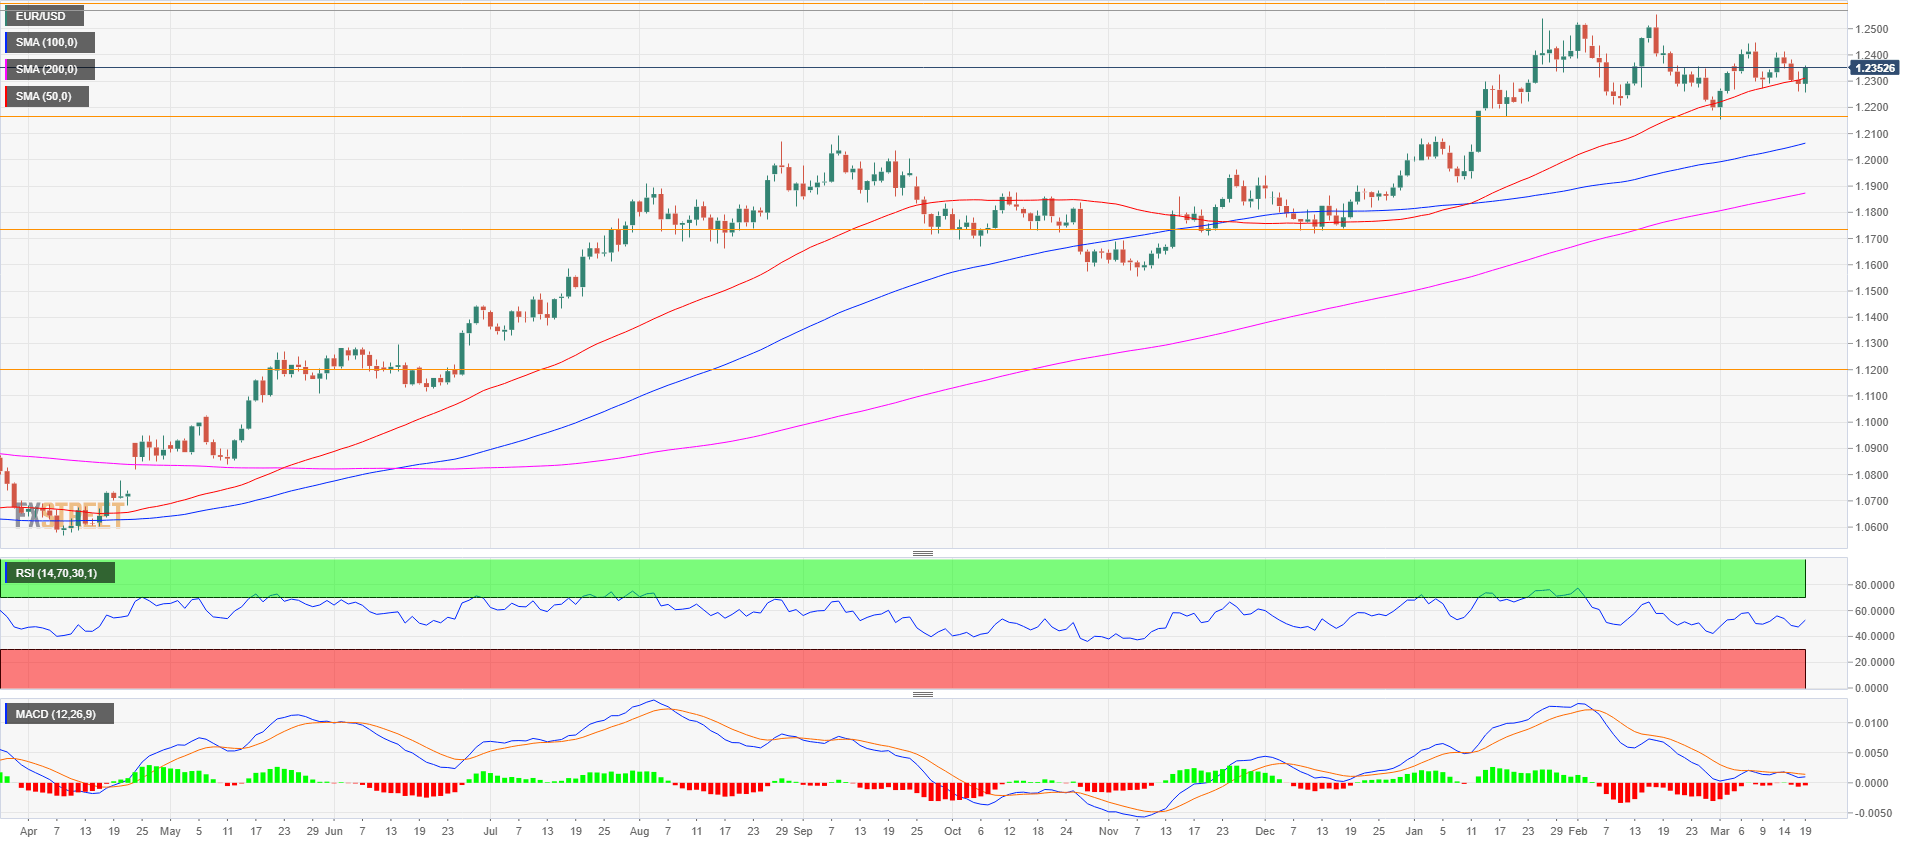
The EUR/USD rebounded at the 50-period simple moving average on Monday, rejecting the 1.2300 figure.
EUR/USD 4-hour chart
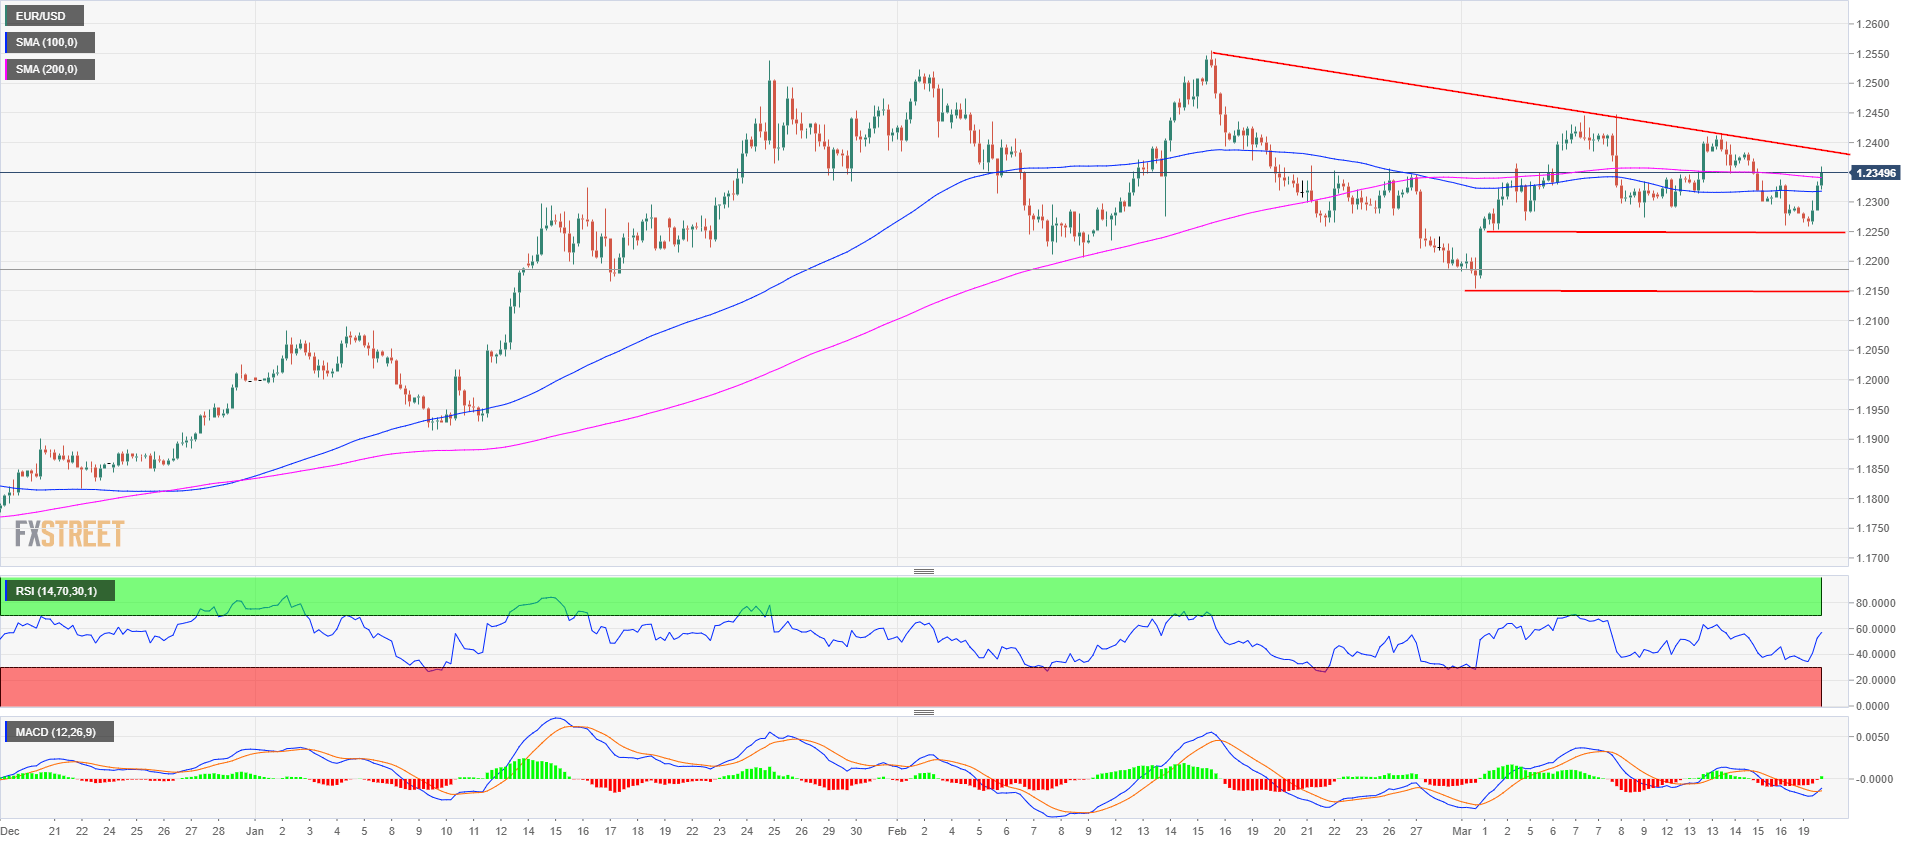
On the 4-hour chart, the EUR/USD pair is breaking above the 100 and 200-period simple moving averages while the RSI is above 50 and the MACD had a moving average crossover below the 0 point which can be seen as bullish activity. Resistance is seen at 1.24 previous swing high and 1.2550 cyclical high. However, a clear breakout above the red trendline is needed to confirm a continuation of the bullish trend. To the downside, support is seen at 1.2250, the last swing low and then all the way to 1.2150 cyclical low.
Author

Flavio Tosti
Independent Analyst