|

EUR/USD technical analysis: The Fiber is under pressure in the New York session, sub-1.1036 level

  • EUR/USD has been under selling pressure since the open in Asia.
  • The level to beat for bears is the 1.1000 level.
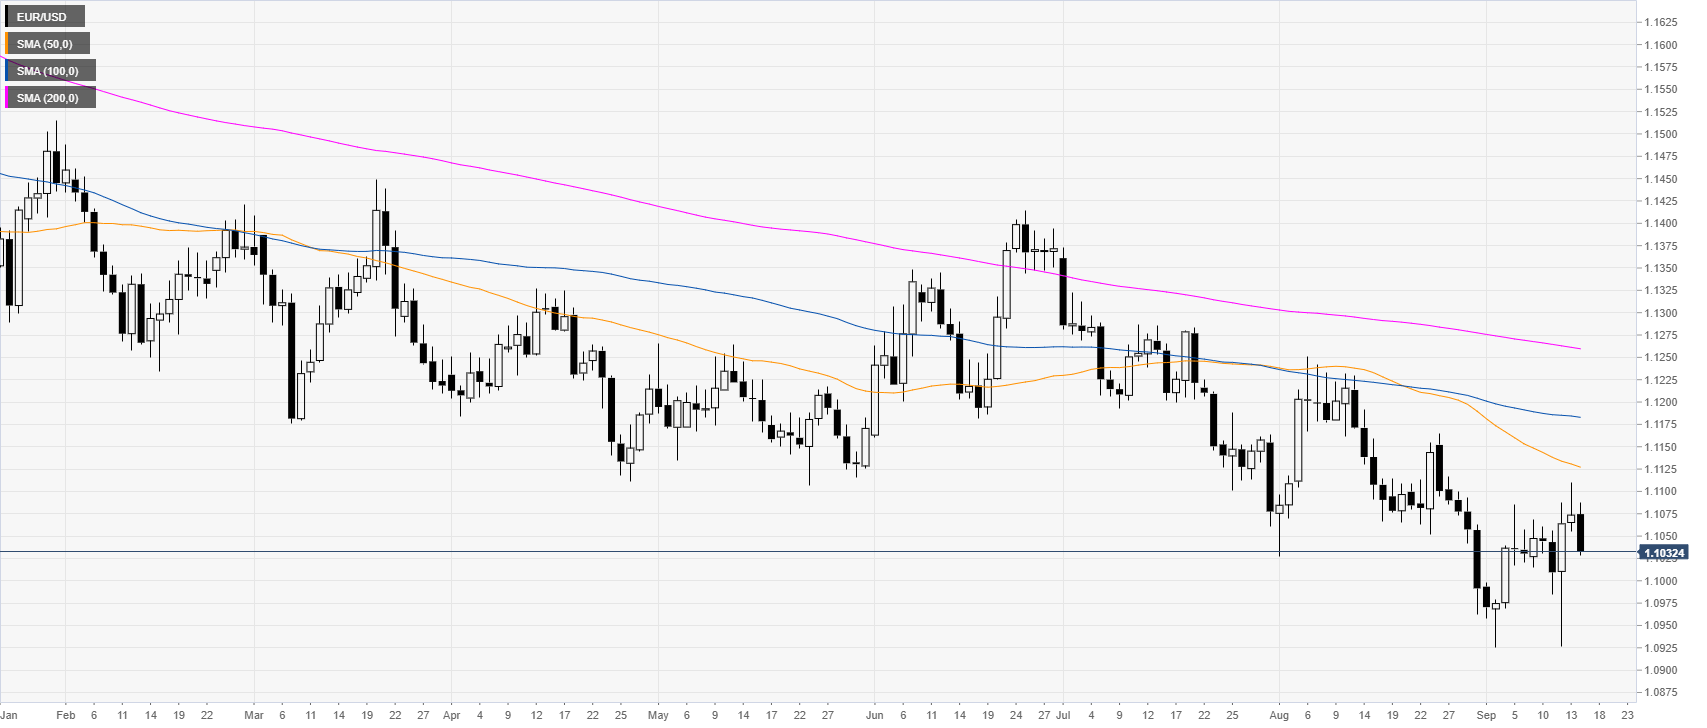
 

EUR/USD daily chart

 
On the daily time-frame, the common currency is trading in a bear trend below its main daily simple moving averages (DSMAs). EUR/USD is starting the week on the back foot as investors will closely be watching the FOMC on Wednesday.

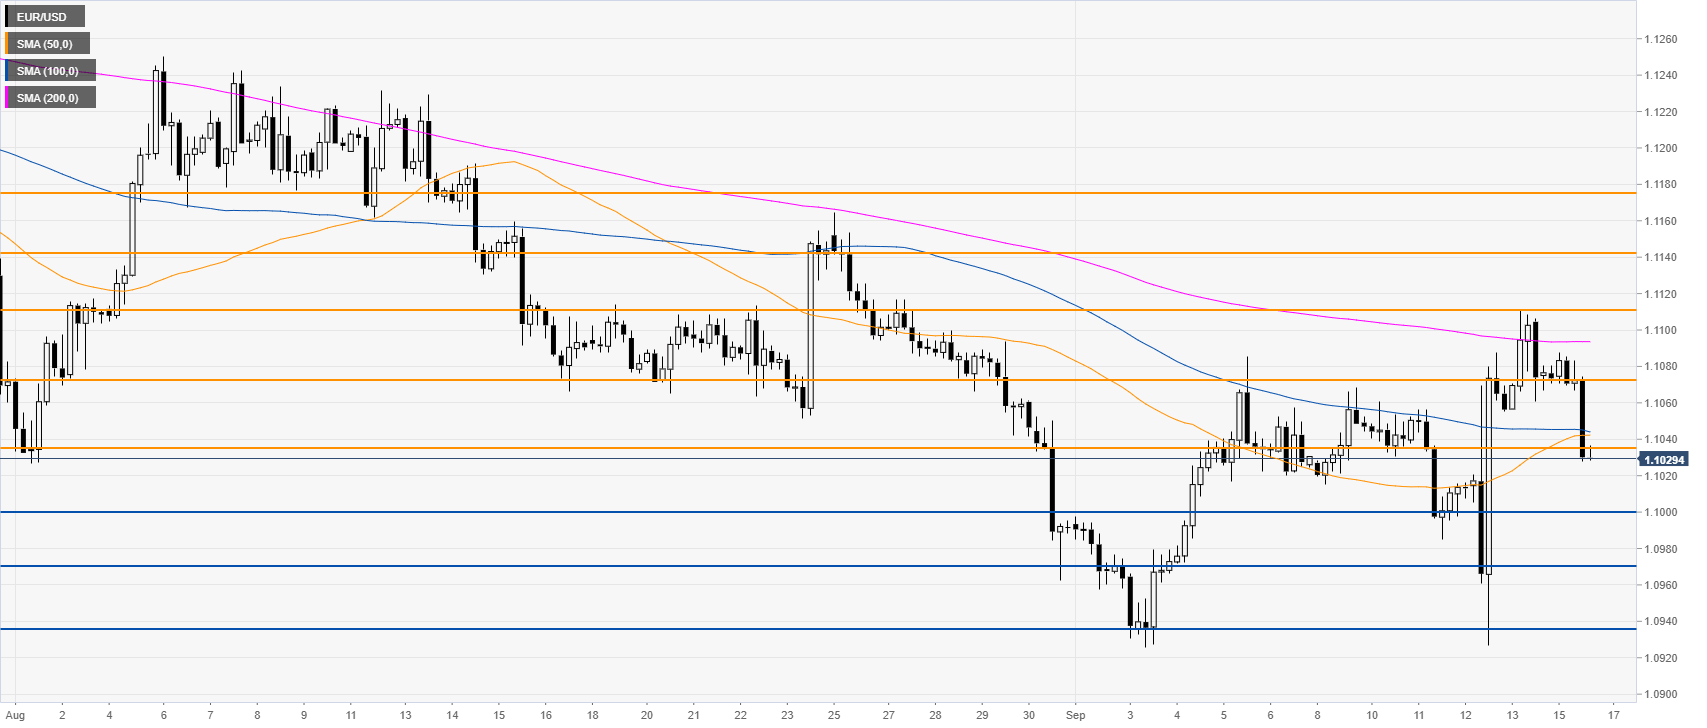
EUR/USD four-hour chart

 
The Fiber rejected the 1.1100 resistance as bears are keeping the pressure on the common currency in the New York session. EUR/USD is trading below 1.1036 resistance and the main SMAs suggesting bearish momentum in the medium term. Support on the way down can be seen at 1.1000, 1.0970 and 1.0935, according to the Technical Confluences Indicator.


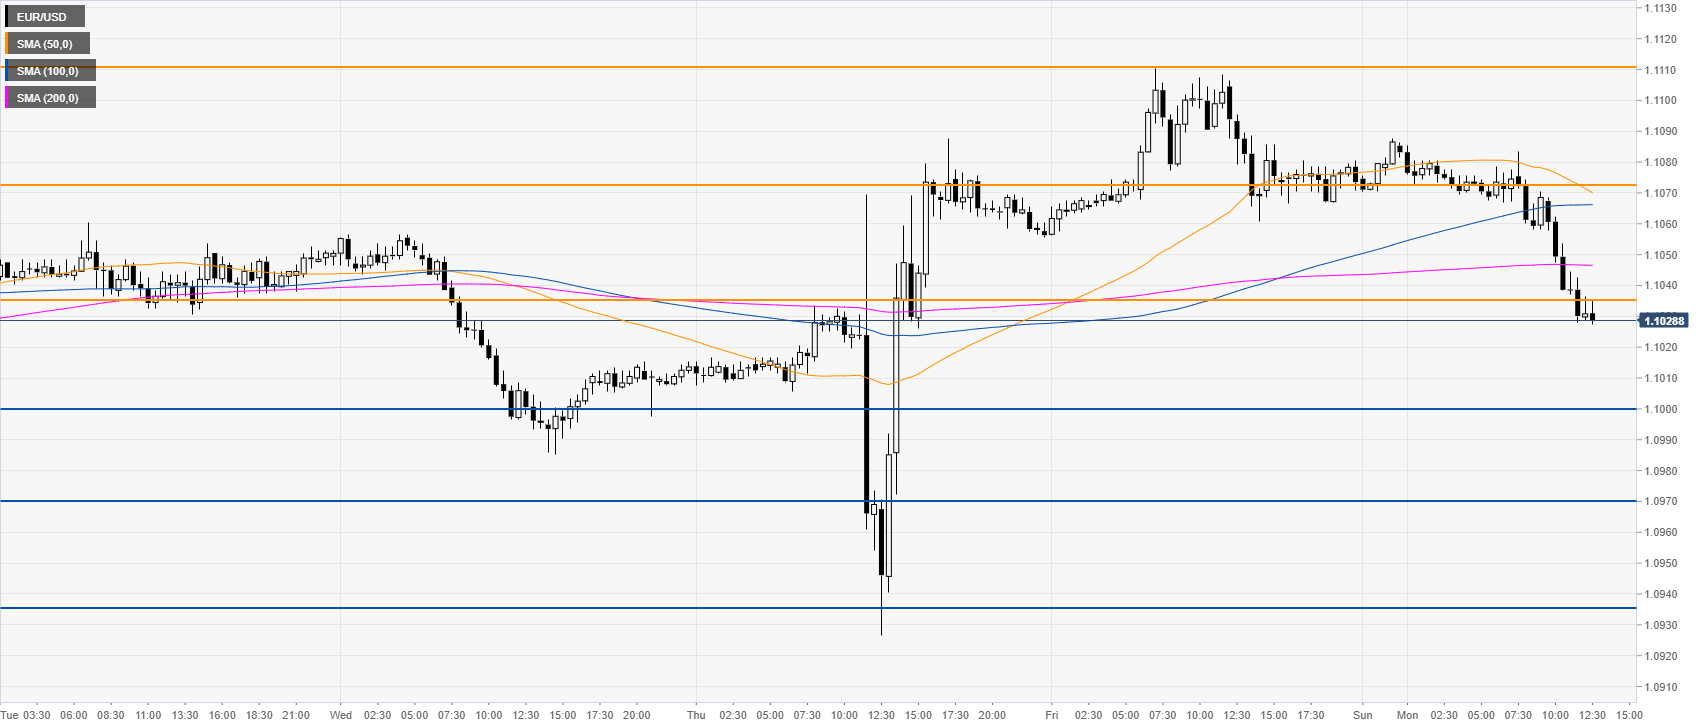
EUR/USD 30-minute chart

 
The market is trading below its main SMAs, suggesting a bearish bias in the short term. Immediate resistance is at 1.1036, 1.1072, followed by the key 1.1110 price level.
 

Additional key levels

EUR/USD

Overview
Today last price1.1027
Today Daily Change-0.0047
Today Daily Change %-0.42
Today daily open1.1074
 
Trends
Daily SMA201.1054
Daily SMA501.1131
Daily SMA1001.1184
Daily SMA2001.1261
Levels
Previous Daily High1.111
Previous Daily Low1.1056
Previous Weekly High1.111
Previous Weekly Low1.0927
Previous Monthly High1.1251
Previous Monthly Low1.0962
Daily Fibonacci 38.2%1.1089
Daily Fibonacci 61.8%1.1077
Daily Pivot Point S11.105
Daily Pivot Point S21.1027
Daily Pivot Point S31.0997
Daily Pivot Point R11.1104
Daily Pivot Point R21.1133
Daily Pivot Point R31.1157

Author

Flavio Tosti

Flavio Tosti

Independent Analyst


More from Flavio Tosti
Share:

Editor's Picks

EUR/USD climbs to daily highs near 1.1820

EUR/USD now picks up pace and advances to the area of daily peaks north of the 1.1800 barrier at the end of the week. The pair’s decent move higher comes against the backdrop of a generalised lack of direction in the FX galaxy and the mild offered stance in the US Dollar.

GBP/USD trims losses, retests 1.3460

After briefly challenging its key 200-day SMA near 1.3440, GBP/USD now manages to regain some balance and revisit the 1.3460 zone on Friday. Cable’s pullback comes as the selling pressure on the Greenback gathers traction, reigniting some recovery in the risk-linked space.

Gold flirts with four-week highs past $5,200

Gold extends its rebound, climbing for a third consecutive session and pushing back above the $5,200 mark per troy ounce on Friday. The move higher continues to draw support from lingering geopolitical tensions and the ongoing uncertainty surrounding US trade policy, both of which are keeping safe-haven demand firmly in play.

Bitcoin, Ethereum and Ripple consolidate with short-term cautious bullish bias

Bitcoin, Ethereum and Ripple are consolidating near key technical areas on Friday, showing mild signs of stabilization after recent volatility. BTC holds above $67,000 despite mild losses so far this week, while ETH hovers around $2,000 after a rejection near its upper consolidation boundary. 

Changing the game: International implications of recent tariff developments

The Supreme Court ruling on International Emergency Economic Powers Act (IEEPA) tariffs provides limited relief for the rest of the world, with weighted average tariff rates modestly lower.

Starknet unveils strkBTC, shielded Bitcoin transactions on Ethereum Layer 2

Starknet, the Ethereum Layer 2 network developed by StarkWare, today announced strkBTC, a wrapped Bitcoin asset that introduces optional shielding while preserving full DeFi composability.