EUR/USD technical analysis: Multiple barriers on the road to recovery, 1.0987 be the closest


  • EUR/USD rises towards a three-week-old falling trend-line, 38.2% Fibonacci retracement.
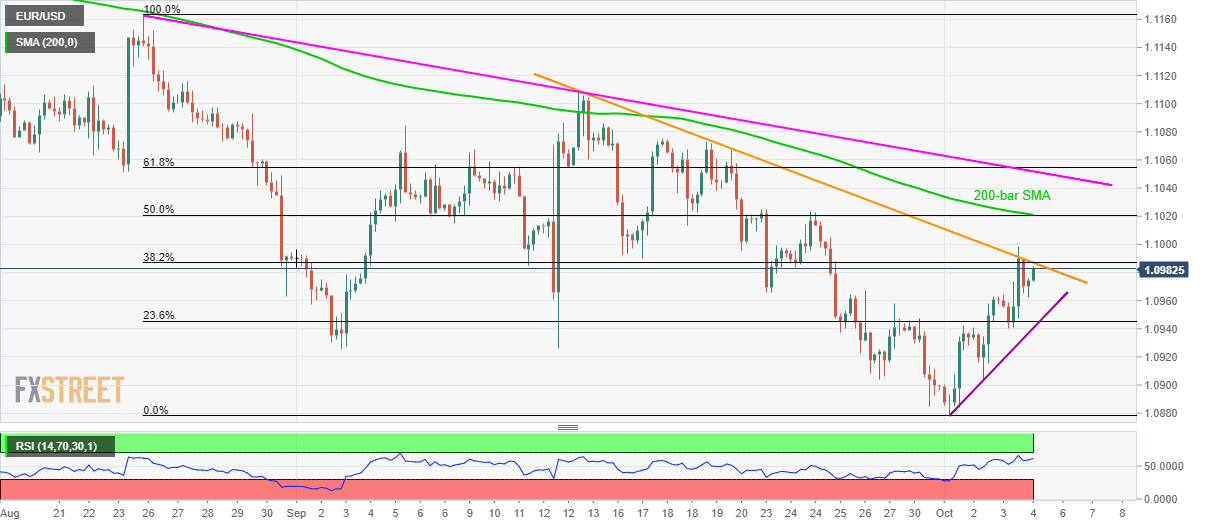
  • 50% Fibonacci retracement, 200-bar SMA and a descending resistance-line since late-August add to the upside barriers.
  • 23.6% Fibonacci retracement, immediate support-line questions pair’s declines.

EUR/USD again aims for 1.0987 resistance-confluence while taking the bids to 1.0980 amid the initial trading session on Friday.

However, rising levels of 14-bar relative strength index (RSI) towards overbought territory might trigger the pair’s another pullback, if not then buyers will target another upside barrier around 1.1020/25 including 200-bar simple moving average (SMA) and 50% Fibonacci retracement of pair’s downpour since late-August.

Should there be additional run-up past-1.1025, a falling trend-line since August 25 and 61.8% Fibonacci retracement, nearing 1.1050/55, will be the key as a break of which can escalate the upward trajectory to mid-September tops close to 1.1110.

During the pair’s pullback, 1.0945/40 area including a three-day-old rising trend-line and 23.6% Fibonacci retracement becomes the key as declines below the same could recall 1.0900 and 1.0880 to the chart

EUR/USD 4-hour chart

Trend: pullback expected

additional important levels

Overview
Today last price 1.0981
Today Daily Change 6 pips
Today Daily Change % 0.05%
Today daily open 1.0975
 
Trends
Daily SMA20 1.1001
Daily SMA50 1.1065
Daily SMA100 1.1154
Daily SMA200 1.1234
 
Levels
Previous Daily High 1.0999
Previous Daily Low 1.0941
Previous Weekly High 1.1026
Previous Weekly Low 1.0905
Previous Monthly High 1.111
Previous Monthly Low 1.0885
Daily Fibonacci 38.2% 1.0977
Daily Fibonacci 61.8% 1.0963
Daily Pivot Point S1 1.0944
Daily Pivot Point S2 1.0913
Daily Pivot Point S3 1.0885
Daily Pivot Point R1 1.1002
Daily Pivot Point R2 1.103
Daily Pivot Point R3 1.1061


Share: Feed news

Information on these pages contains forward-looking statements that involve risks and uncertainties. Markets and instruments profiled on this page are for informational purposes only and should not in any way come across as a recommendation to buy or sell in these assets. You should do your own thorough research before making any investment decisions. FXStreet does not in any way guarantee that this information is free from mistakes, errors, or material misstatements. It also does not guarantee that this information is of a timely nature. Investing in Open Markets involves a great deal of risk, including the loss of all or a portion of your investment, as well as emotional distress. All risks, losses and costs associated with investing, including total loss of principal, are your responsibility. The views and opinions expressed in this article are those of the authors and do not necessarily reflect the official policy or position of FXStreet nor its advertisers. The author will not be held responsible for information that is found at the end of links posted on this page.

If not otherwise explicitly mentioned in the body of the article, at the time of writing, the author has no position in any stock mentioned in this article and no business relationship with any company mentioned. The author has not received compensation for writing this article, other than from FXStreet.

FXStreet and the author do not provide personalized recommendations. The author makes no representations as to the accuracy, completeness, or suitability of this information. FXStreet and the author will not be liable for any errors, omissions or any losses, injuries or damages arising from this information and its display or use. Errors and omissions excepted.

The author and FXStreet are not registered investment advisors and nothing in this article is intended to be investment advice.

Recommended content


Recommended content

Editors’ Picks

AUD/USD hovers around 0.6500 amid light trading, ahead of US GDP

AUD/USD hovers around 0.6500 amid light trading, ahead of US GDP

AUD/USD is trading close to 0.6500 in Asian trading on Thursday, lacking a clear directional impetus amid an Anzac Day holiday in Australia. Meanwhile, traders stay cautious due ti risk-aversion and ahead of the key US Q1 GDP release. 

AUD/USD News

USD/JPY finds its highest bids since 1990, near 155.50

USD/JPY finds its highest bids since 1990, near 155.50

USD/JPY keeps breaking into its highest chart territory since June of 1990 early Thursday, testing 155.50 for the first time in 34 years as the Japanese Yen remains vulnerable, despite looming Japanese intervention risks. Focus shifts to Thursday's US GDP report and the BoJ decision on Friday. 

USD/JPY News

Gold price lacks firm intraday direction, holds steady above $2,300 ahead of US data

Gold price lacks firm intraday direction, holds steady above $2,300 ahead of US data

Gold price remains confined in a narrow band for the second straight day on Thursday. Reduced Fed rate cut bets and a positive risk tone cap the upside for the commodity. Traders now await key US macro data before positioning for the near-term trajectory.

Gold News

Injective price weakness persists despite over 5.9 million INJ tokens burned

Injective price weakness persists despite over 5.9 million INJ tokens burned

Injective price is trading with a bearish bias, stuck in the lower section of the market range. The bearish outlook abounds despite the network's deflationary efforts to pump the price. Coupled with broader market gloom, INJ token’s doomed days may not be over yet.

Read more

Meta Platforms Earnings: META sinks 10% on lower Q2 revenue guidance Premium

Meta Platforms Earnings: META sinks 10% on lower Q2 revenue guidance

This must be "opposites" week. While Doppelganger Tesla rode horrible misses on Tuesday to a double-digit rally, Meta Platforms produced impressive beats above Wall Street consensus after the close on Wednesday, only to watch the share price collapse by nearly 10%.

Read more

Forex MAJORS

Cryptocurrencies

Signatures