EUR/USD Technical Analysis: It is a slow grind up towards the 1.1500 figure

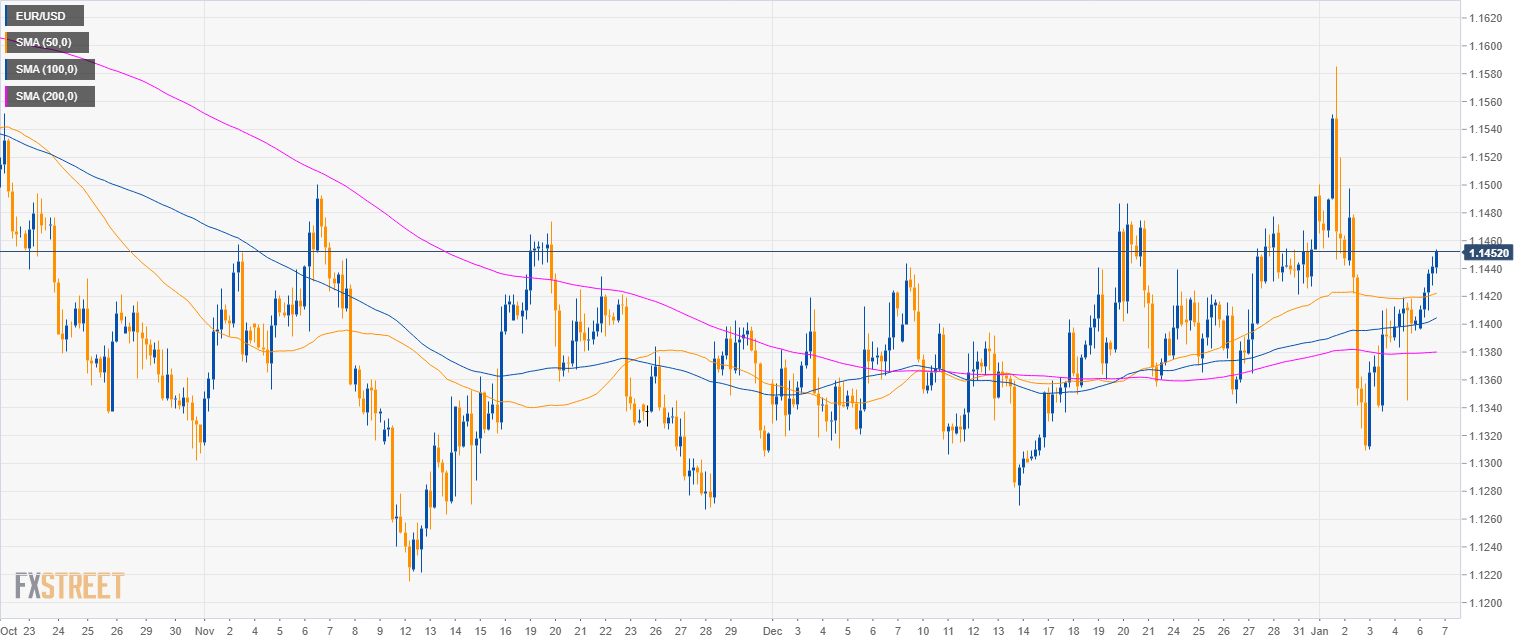
EUR/USD daily chart
- EUR/USD is trading in a bear trend below the 200 SMA.
- EUR/USD is now trapped between the 50 and 100 SMA.
-636824650529360241.png)
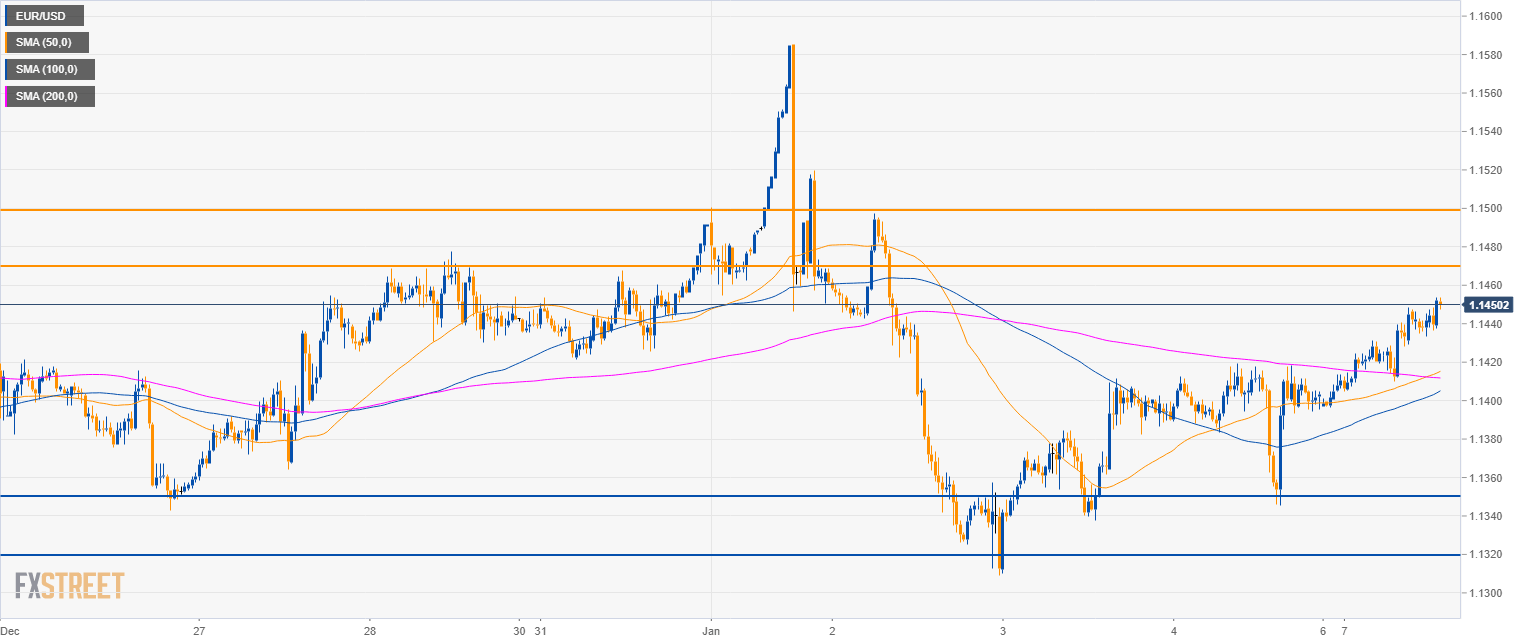
EUR/USD 4-hour chart
- EUR/USD is trading within the range of the last two months.
EUR/USD daily chart
- EUR/USD is trading above its main SMAs suggesting bullish momentum for the time being.
- Resistance to the upside can be seen near 1.1470 and 1.1500 the figure while to the downside 1.1350 and 1.1320 are seen as support.
Additional key levels
EUR/USD
Overview:
Today Last Price: 1.1452
Today Daily change: 49 pips
Today Daily change %: 0.430%
Today Daily Open: 1.1403
Trends:
Previous Daily SMA20: 1.1388
Previous Daily SMA50: 1.1372
Previous Daily SMA100: 1.148
Previous Daily SMA200: 1.1647
Levels:
Previous Daily High: 1.142
Previous Daily Low: 1.1345
Previous Weekly High: 1.1586
Previous Weekly Low: 1.1309
Previous Monthly High: 1.1486
Previous Monthly Low: 1.1269
Previous Daily Fibonacci 38.2%: 1.1391
Previous Daily Fibonacci 61.8%: 1.1374
Previous Daily Pivot Point S1: 1.1359
Previous Daily Pivot Point S2: 1.1315
Previous Daily Pivot Point S3: 1.1285
Previous Daily Pivot Point R1: 1.1433
Previous Daily Pivot Point R2: 1.1463
Previous Daily Pivot Point R3: 1.1507
Author

Flavio Tosti
Independent Analyst


