|

EUR/USD technical analysis: Fiber rolling into the Asian session above the 1.1098 level

  • EUR/USD erased parts of the Friday’s gains this Monday.
  • Indecision can leave the market stuck in a range between 1.1098 and 1.1134 in the near term.
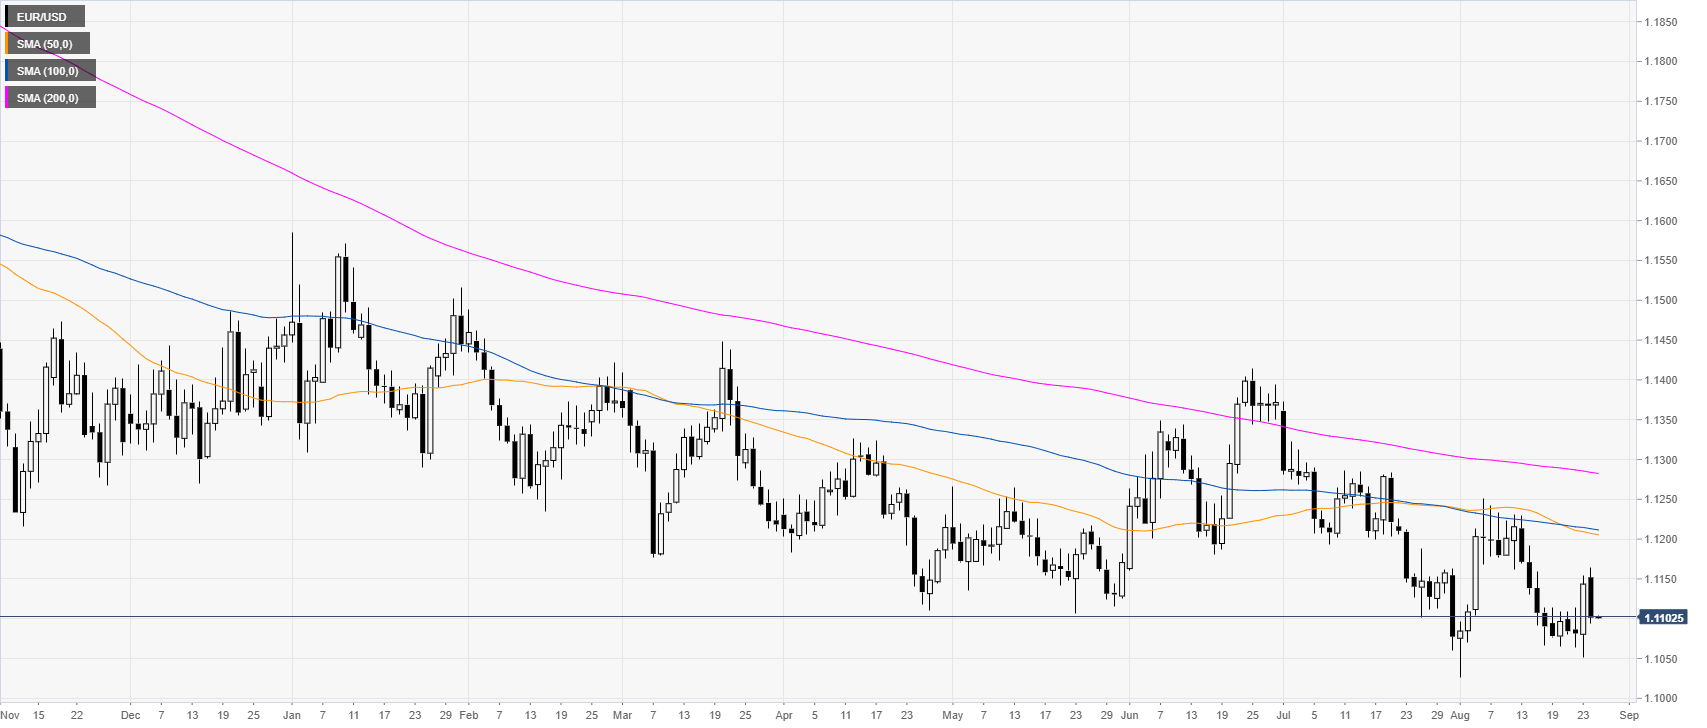
 

EUR/USD daily chart

 
On the daily time-frame, the common currency is trading in a bear trend below its main daily simple moving averages (DSMAs).

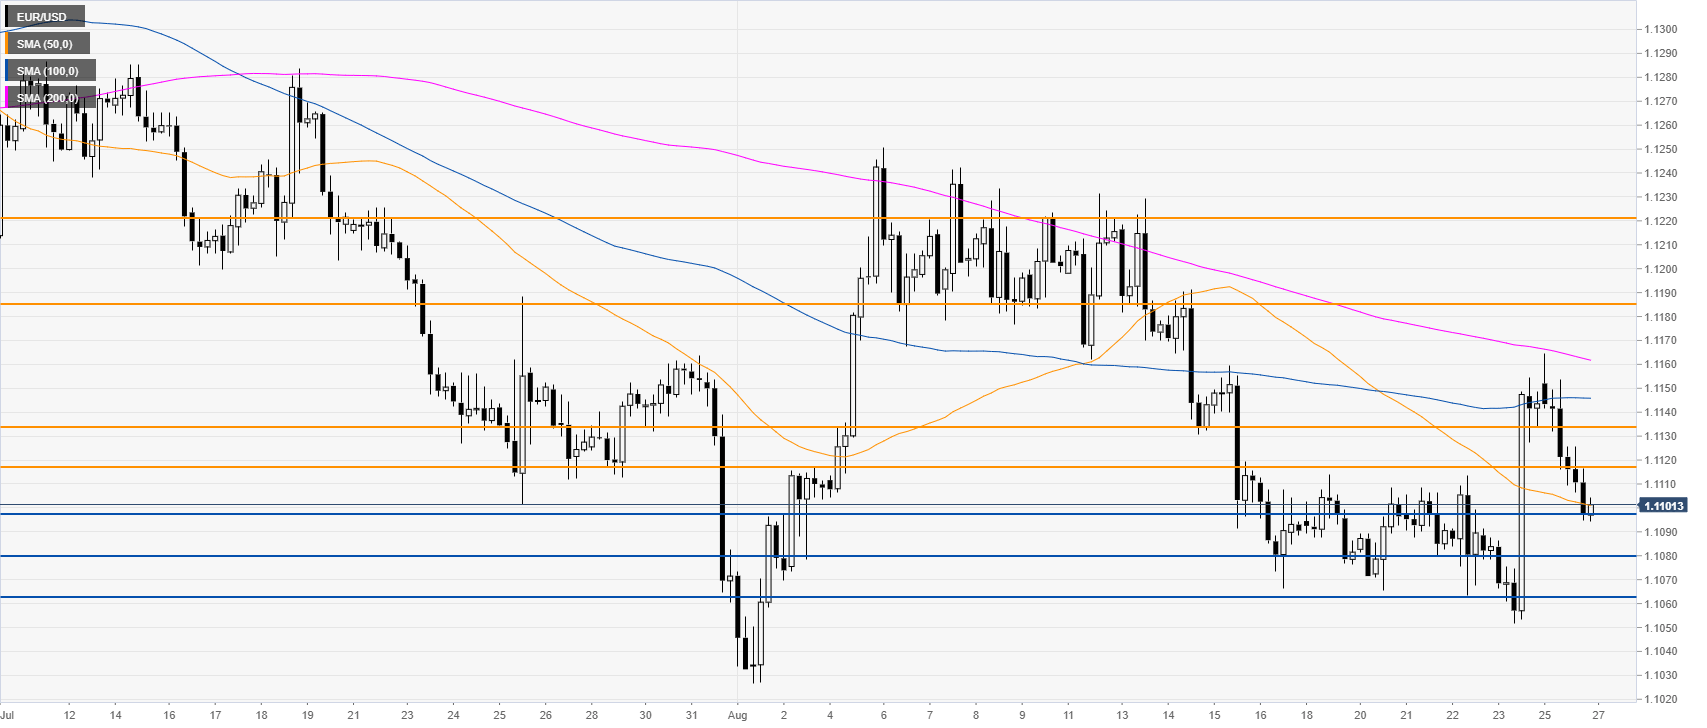
EUR/USD 4-hour chart

 
The Fiber is challenging the 1.1098 support and the 50 SMA. A break below this level can lead to a drop towards the 1.1080 level, according to the Technical Confluences Indicator.
  

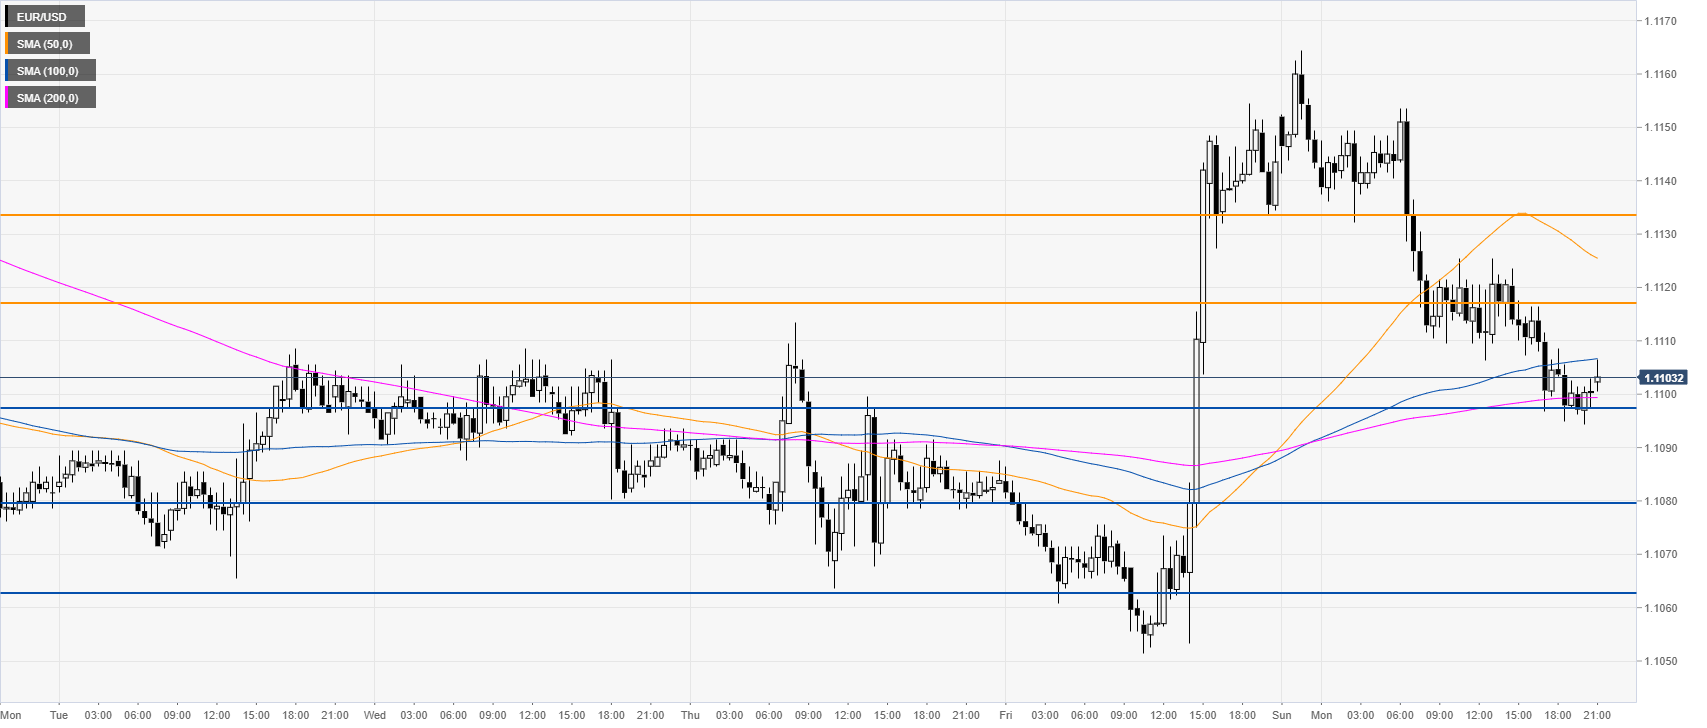
EUR/USD 30-minute chart

 
EUR/USD is challenging the 200 SMA. If bulls step in, they can drive the market towards 1.1115 and 1.1134 resistances.


Additional key levels

EUR/USD

Overview
Today last price1.11
Today Daily Change-0.0044
Today Daily Change %-0.39
Today daily open1.1144
 
Trends
Daily SMA201.1138
Daily SMA501.1209
Daily SMA1001.1215
Daily SMA2001.1286
Levels
Previous Daily High1.1154
Previous Daily Low1.1052
Previous Weekly High1.1154
Previous Weekly Low1.1052
Previous Monthly High1.1373
Previous Monthly Low1.106
Daily Fibonacci 38.2%1.1115
Daily Fibonacci 61.8%1.1091
Daily Pivot Point S11.1078
Daily Pivot Point S21.1014
Daily Pivot Point S31.0976
Daily Pivot Point R11.1182
Daily Pivot Point R21.122
Daily Pivot Point R31.1284

Author

Flavio Tosti

Flavio Tosti

Independent Analyst


More from Flavio Tosti
Share:

Markets move fast. We move first.

Orange Juice Newsletter brings you expert driven insights - not headlines. Every day on your inbox.

By subscribing you agree to our Terms and conditions.

Editor's Picks

EUR/USD bounces toward 1.1750 as US Dollar loses strength

EUR/USD returned to the 1.1750 price zone in the American session on Friday, despite falling Wall Street, which indicates risk aversion. Trading conditions remain thin following the New Year holiday and ahead of the weekend, with the focus shifting to US employment and European data scheduled for next week.

GBP/USD nears 1.3500, holds within familiar levels

After testing 1.3400 on the last day of 2025, GBP/USD managed to stage a rebound. Nevertheless, the pair finds it difficult to gather momentum and trades with modest intraday gains at around 1.3490 as market participants remain in holiday mood.

Gold trims intraday gains, approaches $4,300

Gold retreated sharply from the $4,400  area and trades flat for the day in the $4,320 price zone. Choppy trading conditions exacerbated the intraday decline, although XAU/USD bearish case is out of the picture, considering growing expectations for a dovish Fed and persistent geopolitical tensions.

Cardano gains early New Year momentum, bulls target falling wedge breakout

Cardano kicks off the New Year on a positive note and is extending gains, trading above $0.36 at the time of writing on Friday. Improving on-chain and derivatives data point to growing bullish interest, while the technical outlook keeps an upside breakout in focus.

Economic outlook 2026-2027 in advanced countries: Solidity test

After a year marked by global economic resilience and ending on a note of optimism, 2026 looks promising and could be a year of solid economic performance. In our baseline scenario, we expect most of the supportive factors at work in 2025 to continue to play a role in 2026.

Crypto market outlook for 2026

Year 2025 was volatile, as crypto often is.  Among positive catalysts were favourable regulatory changes in the U.S., rise of Digital Asset Treasuries (DAT), adoption of AI and tokenization of Real-World-Assets (RWA).