|
EUR/USD technical analysis: Fiber is trading near 1.1160 close to the weekly low
- Earlier in the New York session, the Michigan Consumer Index for April came in better-than-anticipated at 102.4 vs. 97.5 forecast.
- EUR/USD dropped about 20 pips down from the 1.1180 resistance on the bullish US data.

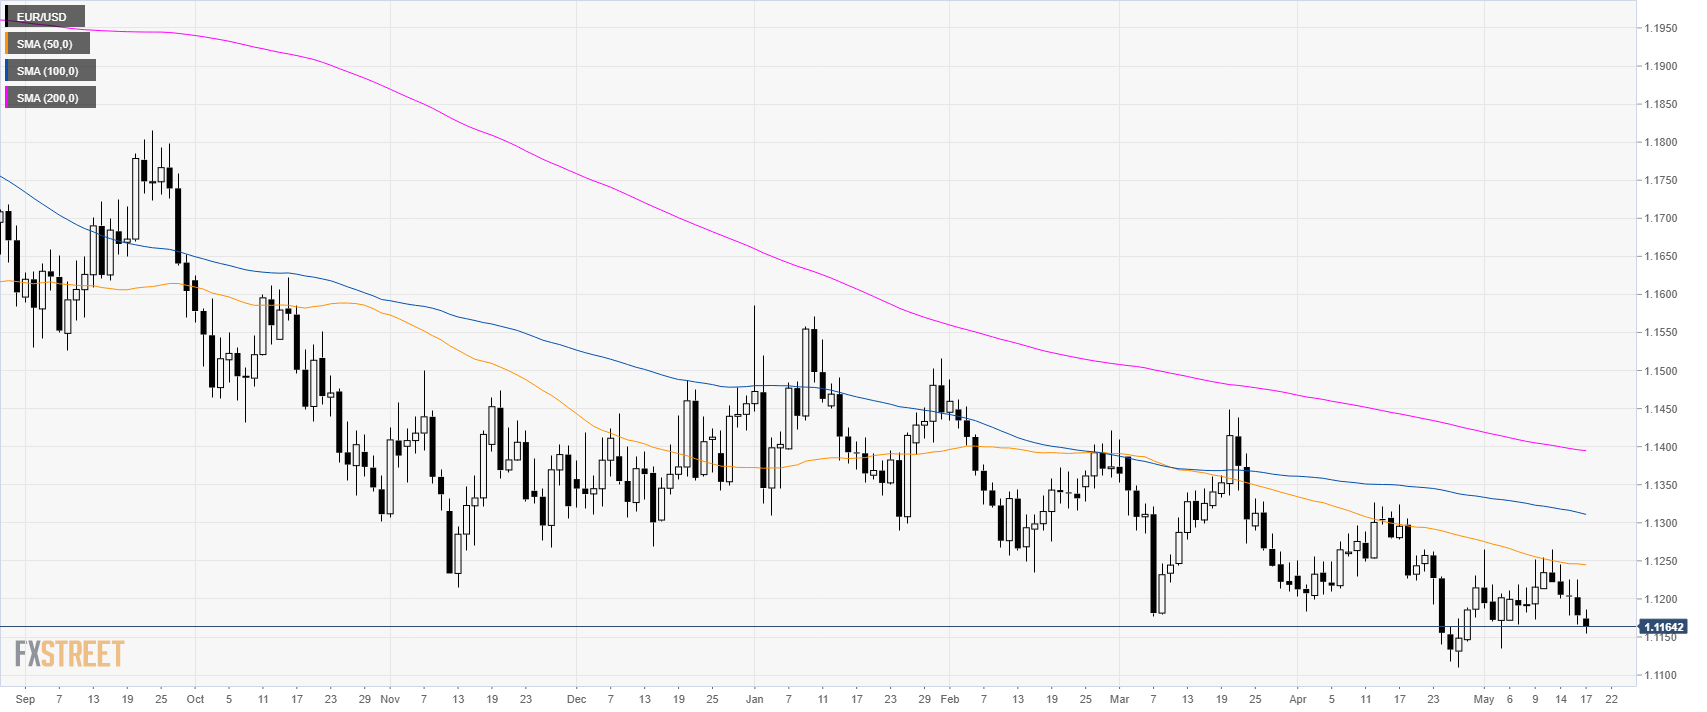
EUR/USD daily chart
EUR/USD is trading in a bear trend below its main simple moving averages (SMAs).
EUR/USD 4-hour chart
EUR/USD is trading below its main SMAs suggesting a bearish bias in the near term.

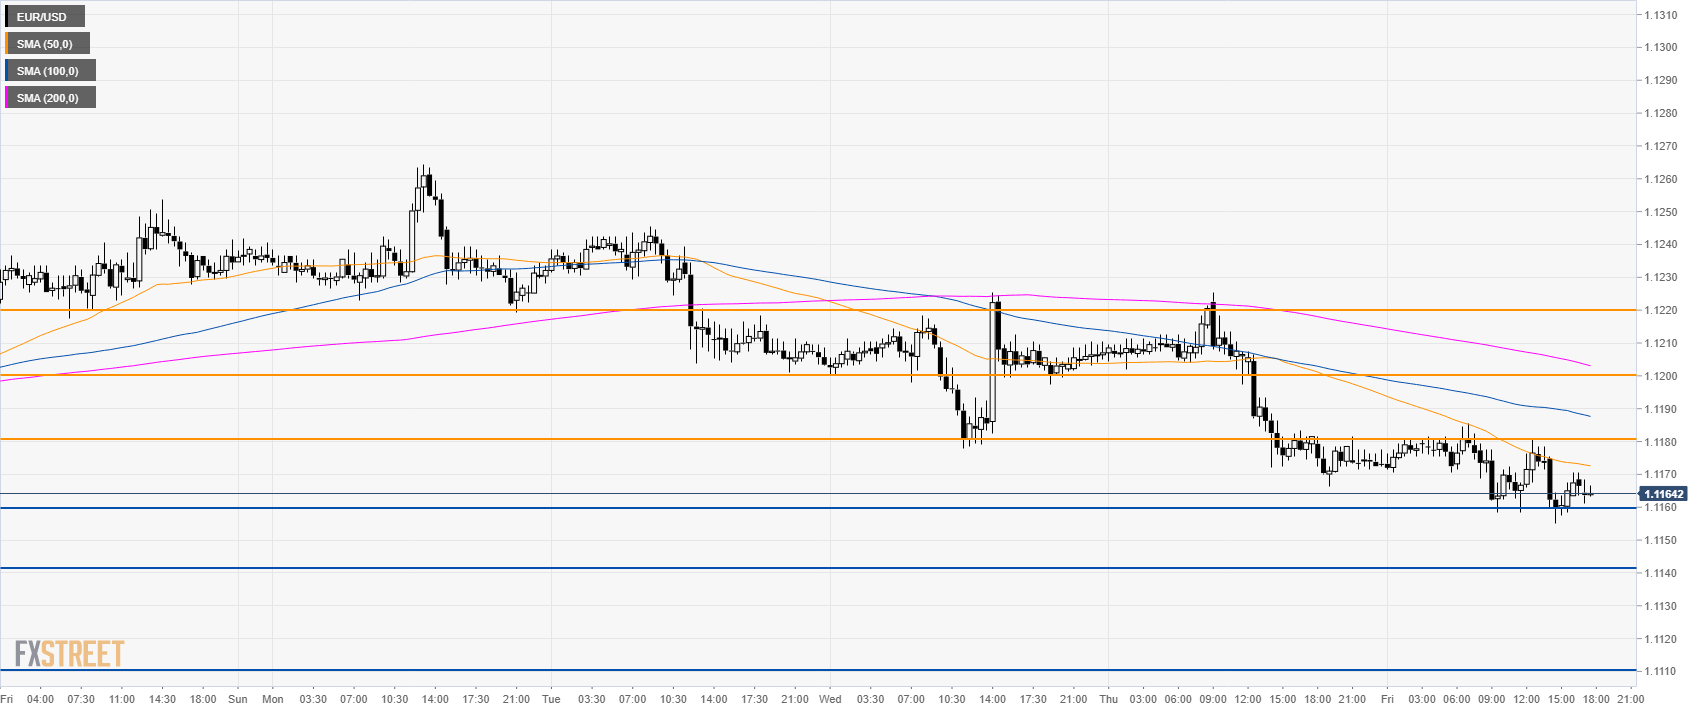
EUR/USD 30-minute chart
The market is trading below its main SMAs suggesting bearish momentum in the short term. The market is repeatedly challenging 1.1160 support. A break below this level can lead to 1.1140 and 1.1110 to the downside. Resistance is seen at 1.1180, 1.1200 and 1.1220 levels.
Additional key levels
Author

Flavio Tosti
Independent Analyst
More from Flavio Tosti


