|

EUR/USD technical analysis: Fiber enters the New York session below the 1.1200 handle

  • EUR/USD is trading within a small daily range at the start of the New York session. 
  • The key level to beat for bears is the 1.1160 support. 
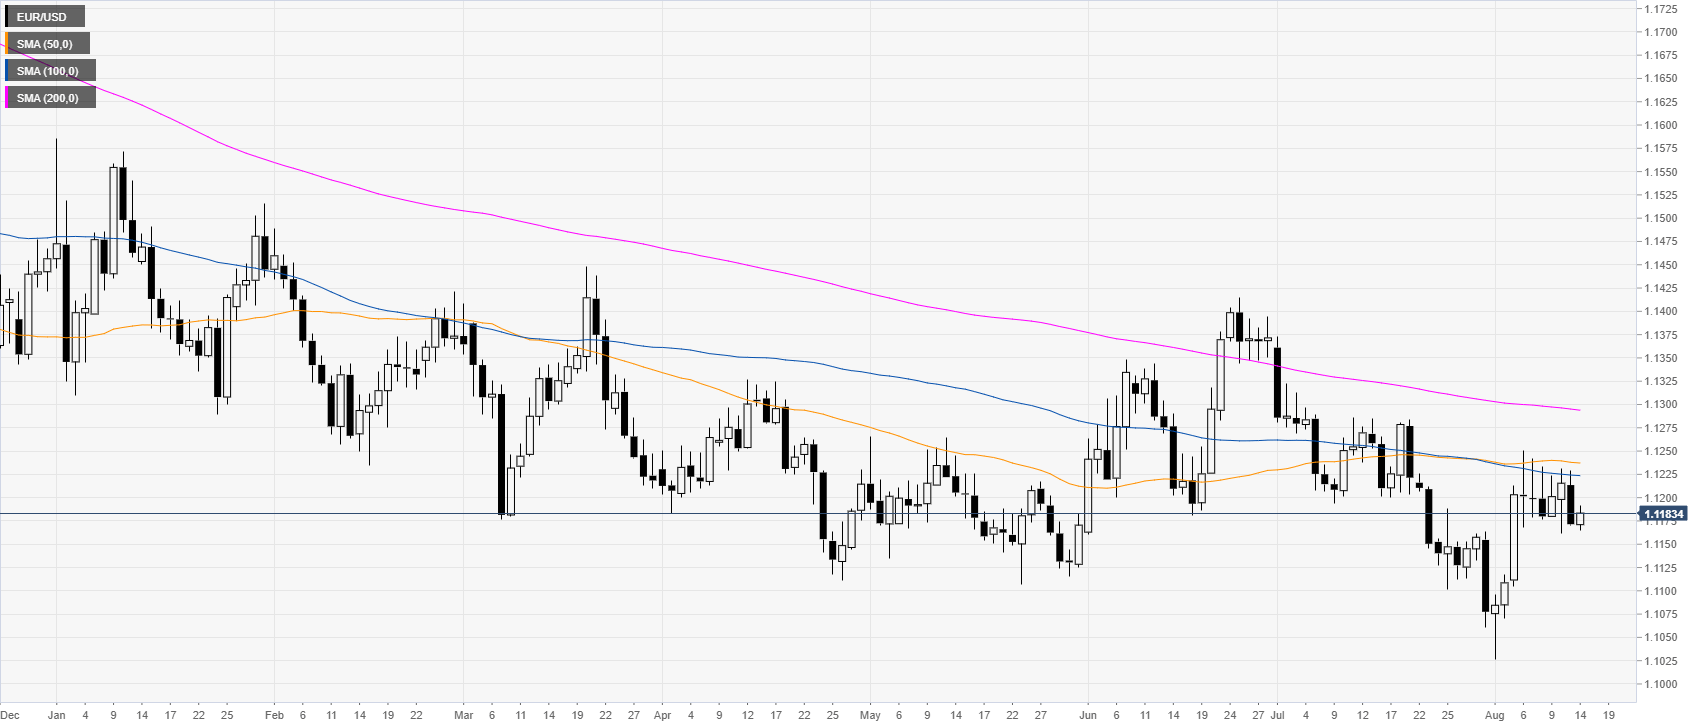
 

EUR/USD daily chart

 
EUR/USD is keeping the range theme intact for the seventh consecutive days. On the daily time-frame, the common currency is capped by the 1.1220/55 resistances as well as the 50/100-day simple moving averages (DSMAs). 
 

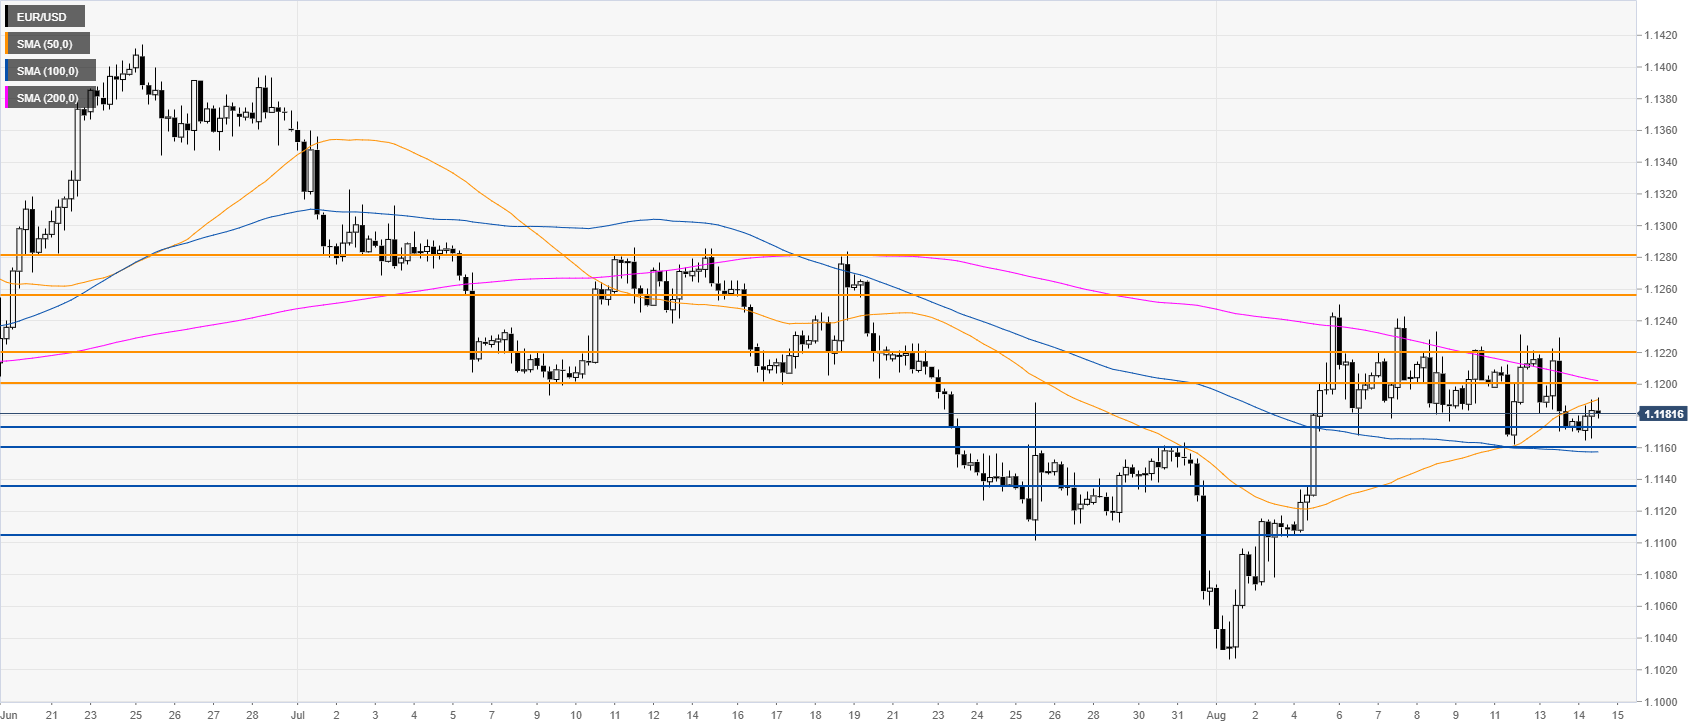
EUR/USD 4-hour chart

 
EUR/USD is ranging between the 1.1255 resistance and the 1.1160 support while the market is trading below a downward sloping 200 SMA and below a rising 50 SMA. Bears will need to break below the 1.1173 support and most importantly below 1.1160 to confirm a bearish bias in the medium term. 


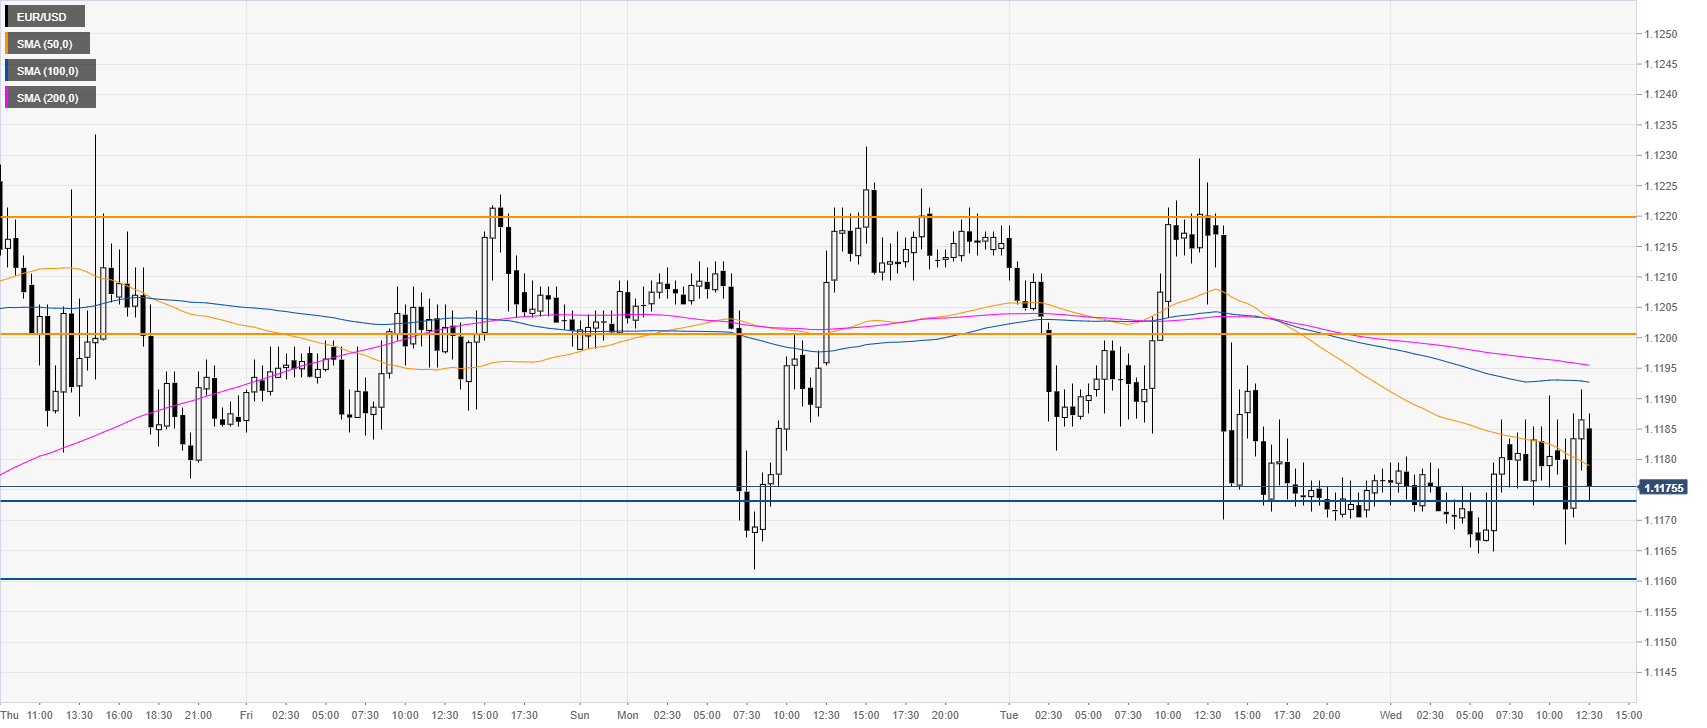
EUR/USD 30-minute chart

 
The market is trading below its main SMAs, suggesting a bearish bias in the near term. Immediate resistances are seen at 1.1200 and 1.1220, according to the Technical Confluences Indicator


Additional key levels


EUR/USD

Overview
Today last price1.1182
Today Daily Change0.0010
Today Daily Change %0.09
Today daily open1.1172
 
Trends
Daily SMA201.1172
Daily SMA501.1238
Daily SMA1001.1224
Daily SMA2001.1295
Levels
Previous Daily High1.1229
Previous Daily Low1.117
Previous Weekly High1.1251
Previous Weekly Low1.1104
Previous Monthly High1.1373
Previous Monthly Low1.106
Daily Fibonacci 38.2%1.1193
Daily Fibonacci 61.8%1.1207
Daily Pivot Point S11.1151
Daily Pivot Point S21.1131
Daily Pivot Point S31.1092
Daily Pivot Point R11.1211
Daily Pivot Point R21.125
Daily Pivot Point R31.127

Author

Flavio Tosti

Flavio Tosti

Independent Analyst


More from Flavio Tosti
Share:

Editor's Picks

EUR/USD flirts with weekly lows near 1.1770

EUR/USD now comes under further selling pressure, breaking below the 1.1800 support to challenge the area of weekly throughs near 1.1770 on Thursday. The pair’s decline comes in response to marked gains in the US Dollar amid steady geopolitical tensions. Ealier in the day, the ECB’s Lagarde delivered cautious remarks, although the currency remained apathetic.

GBP/USD threatens the 200-day SMA near 1.3440

GBP/USD rapidly leaves behind Wednesday’s strong advance, coming under heavy pressure and retesting the 1.3440 zone, where the critical 200-day SMA is located. Cable’s deep pullback follows the strong gains in the Greenback, while investors continue to pencil in a potential BoE rate cut in March.

Gold trims gains, slips back to around $5,170

Gold is now facing some downside pressure, hovering around the $5,170 region on Thursday. The yellow metal surrenders part of its earlier gains on the back of the resurgence of the buying interest in the Greenback. In the meantime, geopolitical tensions in the Middle East continue to limit the downside potential for now.

Stellar: Relief bounce fades as bearish undertone persists

Stellar is trading around $0.16 at the time of writing on Thursday after rebounding more than 8% in the previous day. Derivatives data paints a negative picture as XLM’s short bets hit a monthly high while Open Interest continues to decline.

Changing the game: International implications of recent tariff developments

The Supreme Court ruling on International Emergency Economic Powers Act (IEEPA) tariffs provides limited relief for the rest of the world, with weighted average tariff rates modestly lower.

Bitcoin steadies as traders eye US–Iran talks

Bitcoin (BTC) price is stabilizing around $68,000 at the time of writing on Thursday after a 6.2% relief rally the previous day amid a broader downward trend.