|

EUR/USD technical analysis: Fiber drifting below the 1.1100 figure into the London close

  • EUR/USD is trading below 1.1100 as the London session comes to an end. 
  • The level to beat for bears is at 1.1080 support.
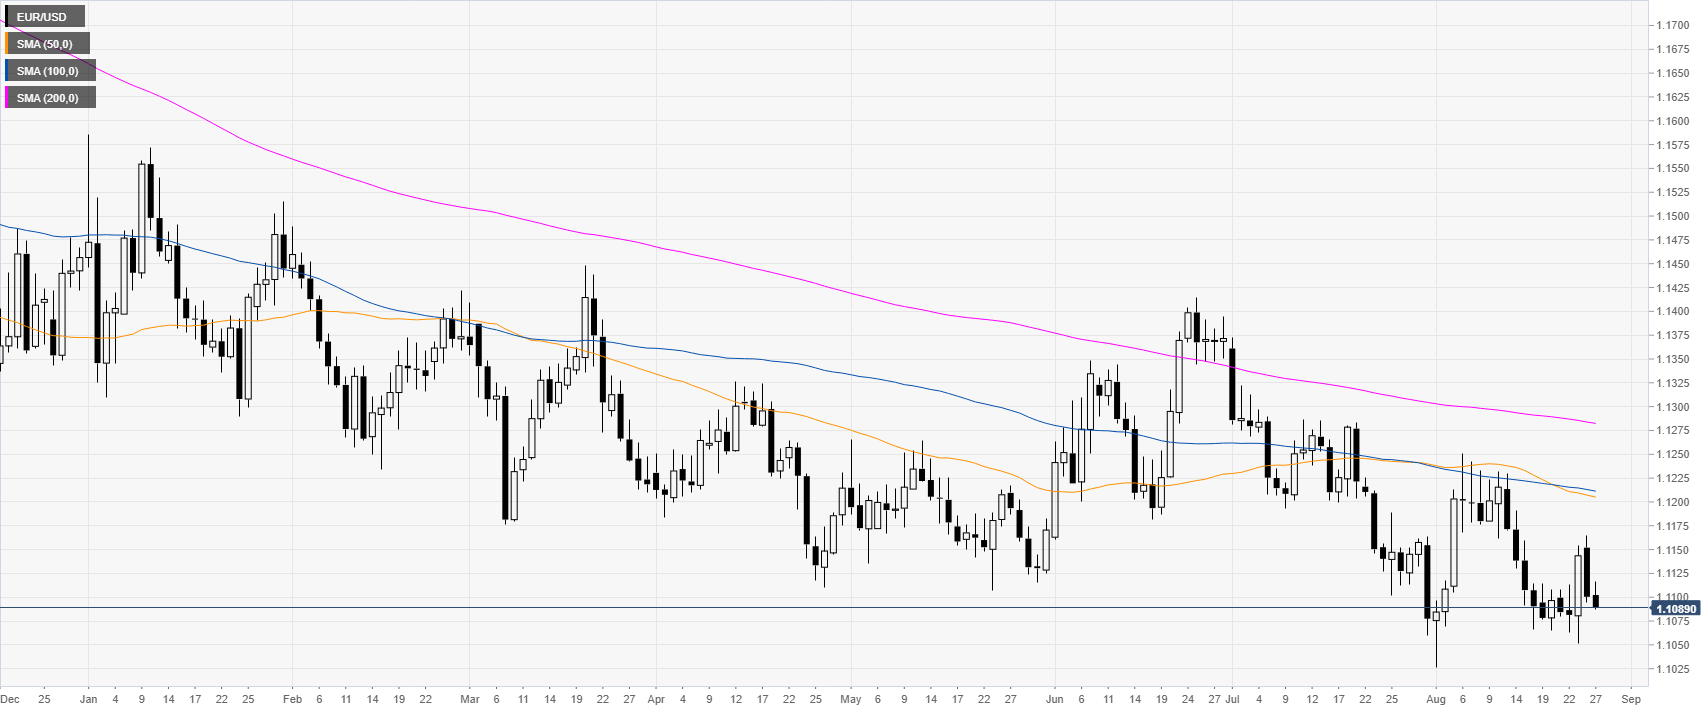
 

EUR/USD daily chart

 
On the daily time-frame, the single currency is trading in a bear trend below the main daily simple moving averages (DSMAs).

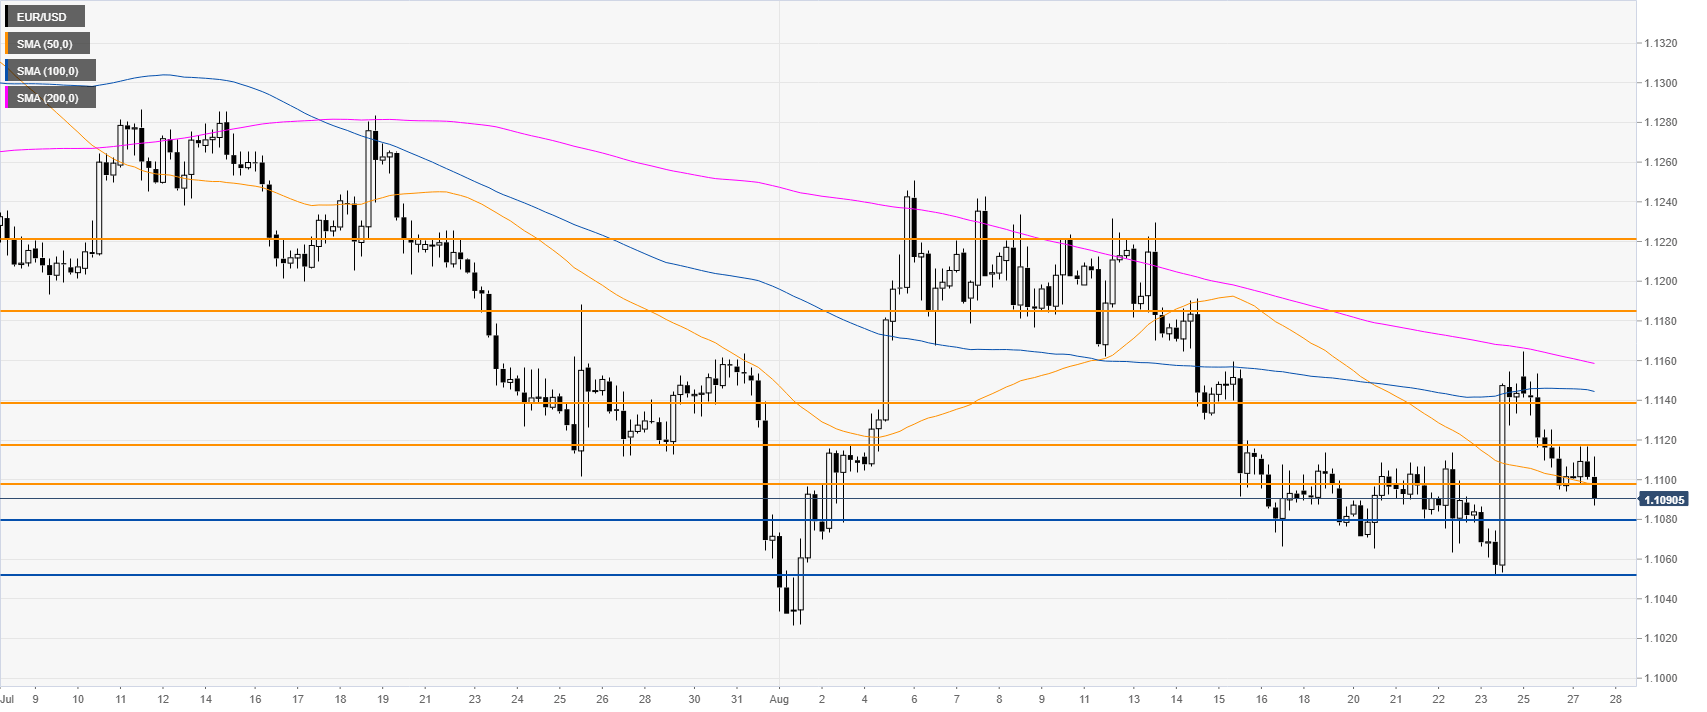
EUR/USD 4-hour chart

 
Fiber is breaking below 1.1098 support. If the bears keep the pressure, the market may drop towards the 1.1080 and 1.1052 levels, according to the Technical Confluences Indicator.


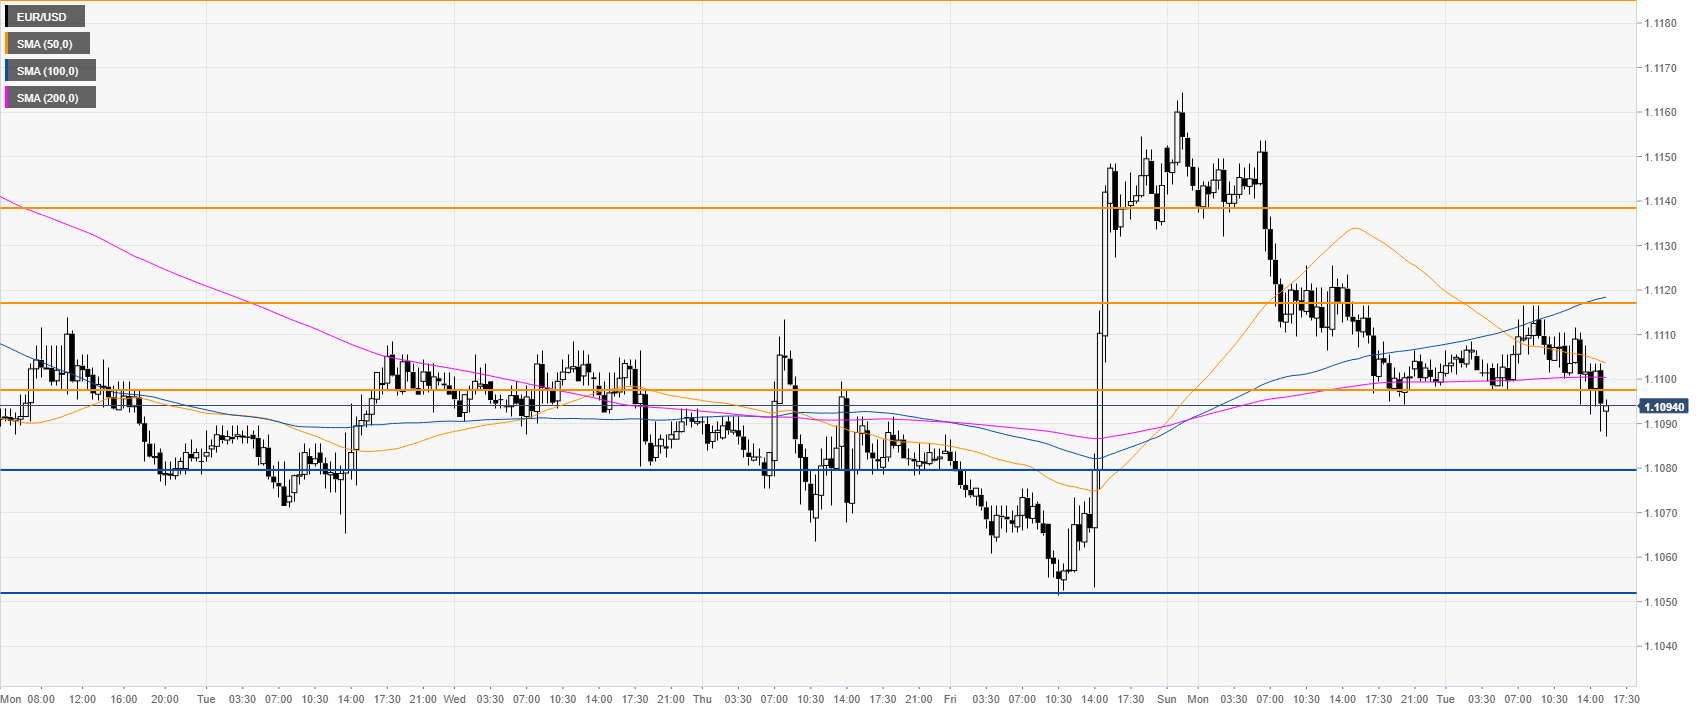
EUR/USD 30-minute chart

 
EUR/USD is trading at daily lows below its main SMAs suggesting bearish momentum. The bear breakout so far seems to lack conviction so it remains to be seen how the bears will sustain the move on Wednesday. Immediate resistance is seen at 1.1098, 1.1117 and 1.1134 levels, according to the Technical Confluences Indicator.


Additional key levels

EUR/USD

Overview
Today last price1.109
Today Daily Change-0.0010
Today Daily Change %-0.09
Today daily open1.11
 
Trends
Daily SMA201.1136
Daily SMA501.1207
Daily SMA1001.1213
Daily SMA2001.1284
Levels
Previous Daily High1.1164
Previous Daily Low1.1094
Previous Weekly High1.1154
Previous Weekly Low1.1052
Previous Monthly High1.1373
Previous Monthly Low1.106
Daily Fibonacci 38.2%1.1121
Daily Fibonacci 61.8%1.1138
Daily Pivot Point S11.1075
Daily Pivot Point S21.105
Daily Pivot Point S31.1005
Daily Pivot Point R11.1145
Daily Pivot Point R21.119
Daily Pivot Point R31.1215

Author

Flavio Tosti

Flavio Tosti

Independent Analyst


More from Flavio Tosti
Share:

Markets move fast. We move first.

Orange Juice Newsletter brings you expert driven insights - not headlines. Every day on your inbox.

By subscribing you agree to our Terms and conditions.

Editor's Picks

EUR/USD could test 1.1750 amid strengthening bullish bias

EUR/USD remains flat after two days of small losses, trading around 1.1740 during the Asian hours on Thursday. On the daily chart, technical analysis indicates a strengthening of a bullish bias, as the pair continues to trade within an ascending channel pattern.

GBP/USD consolidates above mid-1.3300s as traders await BoE and US CPI report

The GBP/USD pair struggles to capitalize on the overnight bounce from the 1.3310 area, or a one-week low, and oscillates in a narrow band during the Asian session on Thursday. Spot prices currently trade around the 1.3370 region, down less than 0.10% for the day, as traders opt to wait on the sidelines ahead of the key central bank event risk and US consumer inflation data.

Gold awaits weekly trading range breakout ahead of US CPI report

Gold struggles to capitalize on the previous day's move higher back closer to the $4,350 level and trades with a mild negative bias during the Asian session on Thursday. The downtick could be attributed to some profit-taking amid a US Dollar uptick, though it is likely to remain cushioned on the back of a supportive fundamental backdrop. 

Dogecoin breaks key support amid declining investor confidence

Dogecoin trades in the red on Thursday, following a 4% decline on the previous day. The DOGE supply in profit declines as large wallet investors trim their portfolios. Derivatives data shows a surge in bearish positions amid declining retail interest.

Monetary policy: Three central banks, three decisions, the same caution

While the Fed eased its monetary policy on 10 December for the third consecutive FOMC meeting, without making any guarantees about future action, the BoE, the ECB and the BoJ are holding their respective meetings this week. 

Dogecoin Price Forecast: DOGE breaks key support amid declining investor confidence

Dogecoin (DOGE) trades in the red on Thursday, following a 4% decline on the previous day. The DOGE supply in profit declines as large wallet investors trim their portfolios. Derivatives data shows a surge in bearish positions amid declining retail interest.