|
EUR/USD technical analysis: Fiber at daily lows challenging 1.1173 support
- USTR additional tariffs on some products will be delayed to December 15.
- Risk-on is sending the greenback up and safe-haven assets down.
- EUR/USD is testing the daily lows near 1.1173 support.

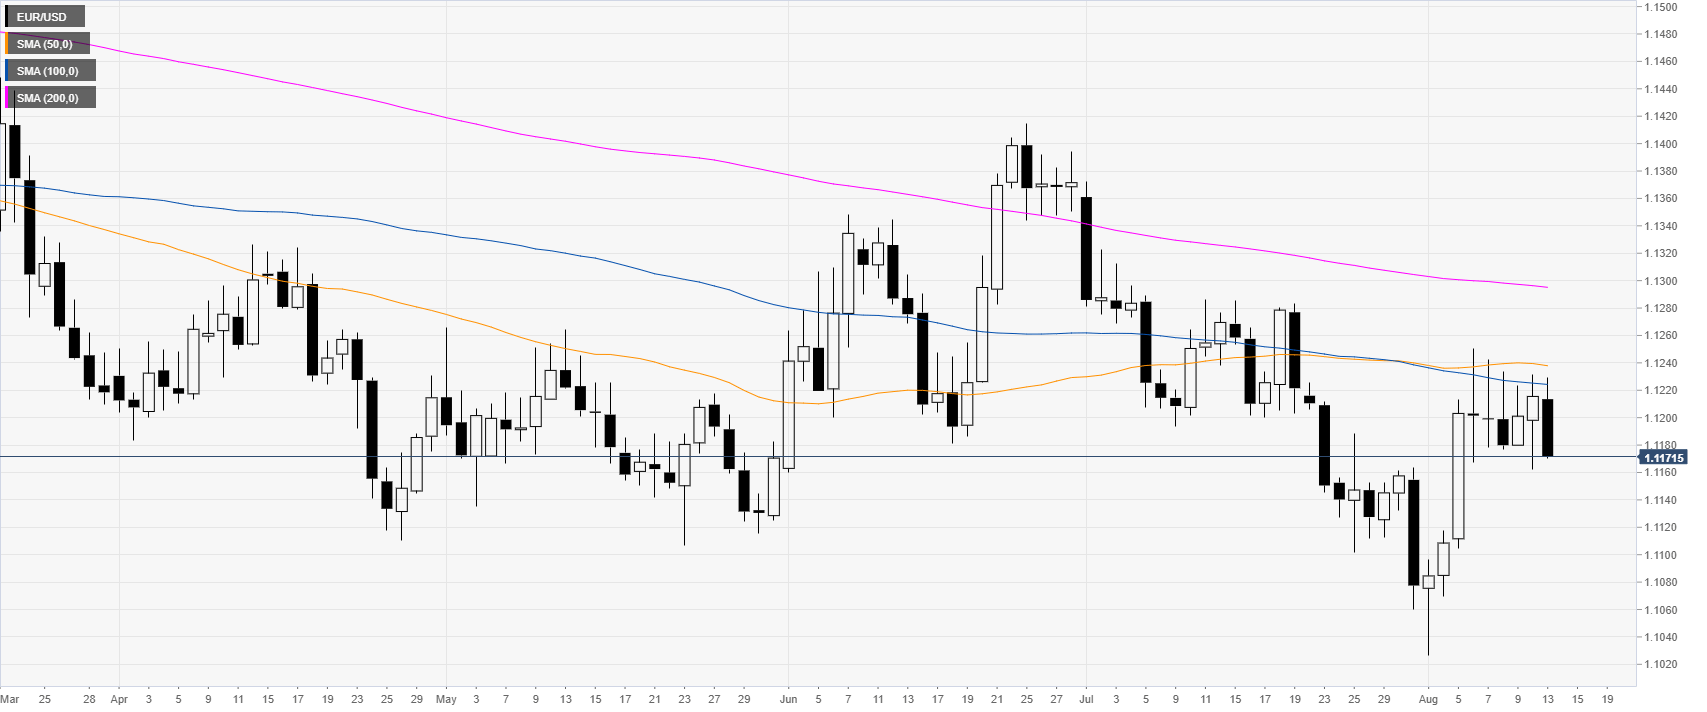
EUR/USD daily chart
EUR/USD is consolidating for the sixth consecutive day. The common currency is capped by the 1.1220/55 resistances as well as the 50/100-day simple moving averages (DSMAs). The US said that some tariffs are to be delayed until December 15. The news sparked a risk-on environment as US stock indices leapt higher, safe-haven gold, yen and CHF sold-off and the greenback rose.
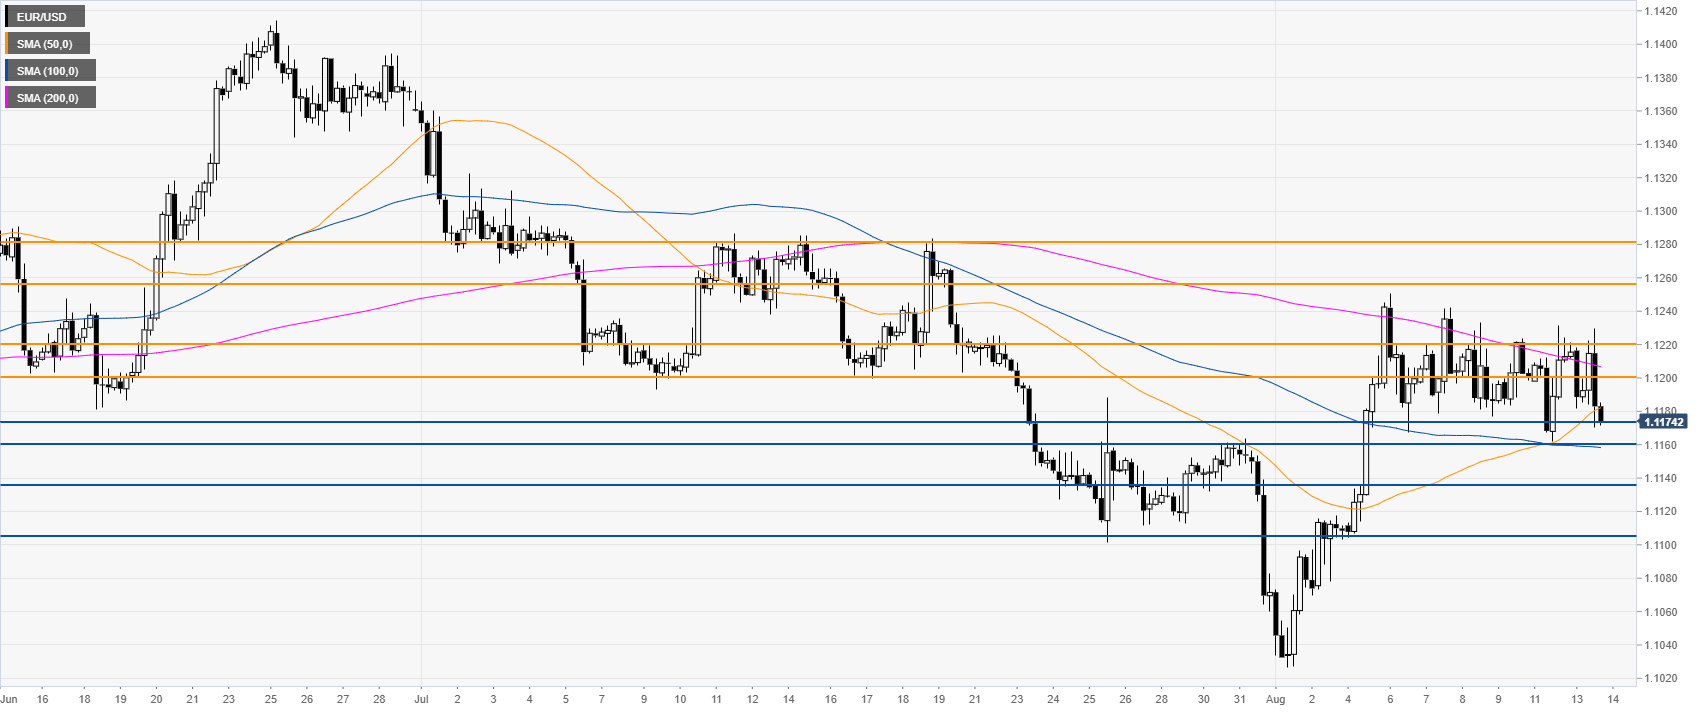
EUR/USD 4-hour chart
EUR/USD remains in a range between the 1.1255 resistance and the 1.1160 support while the market is trading below a downward sloping 200 SMA. Bears are testing the 1.1173 support. However, EUR/USD would need a daily close below 1.1160 to confirm a bearish bias in the medium term.
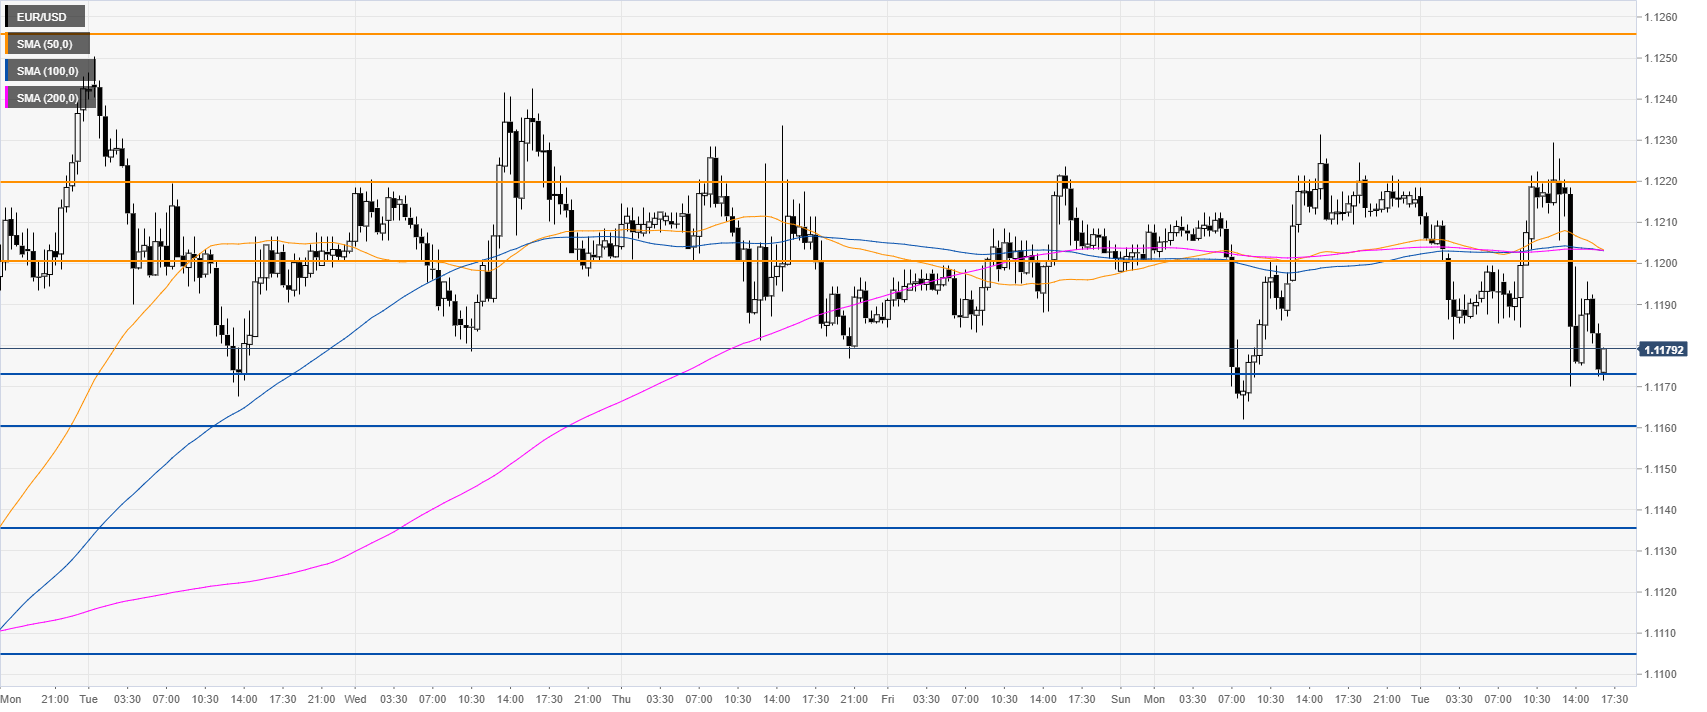
EUR/USD 30-minute chart
The market is testing the 1.1173 while below its main SMAs. The range theme is intact above 1.1160. Immediate resistances are seen at 1.1200 and 1.1220, according to the Technical Confluences Indicator.
Additional key levels
Author

Flavio Tosti
Independent Analyst
More from Flavio Tosti


