|
EUR/USD technical analysis: Euro rolling into the Asian session flirting with the 1.1000 handle
- The market starts the week buying US Dollars and bringing EUR/USD down.
- The level to beat for bears is the 1.1000 level.
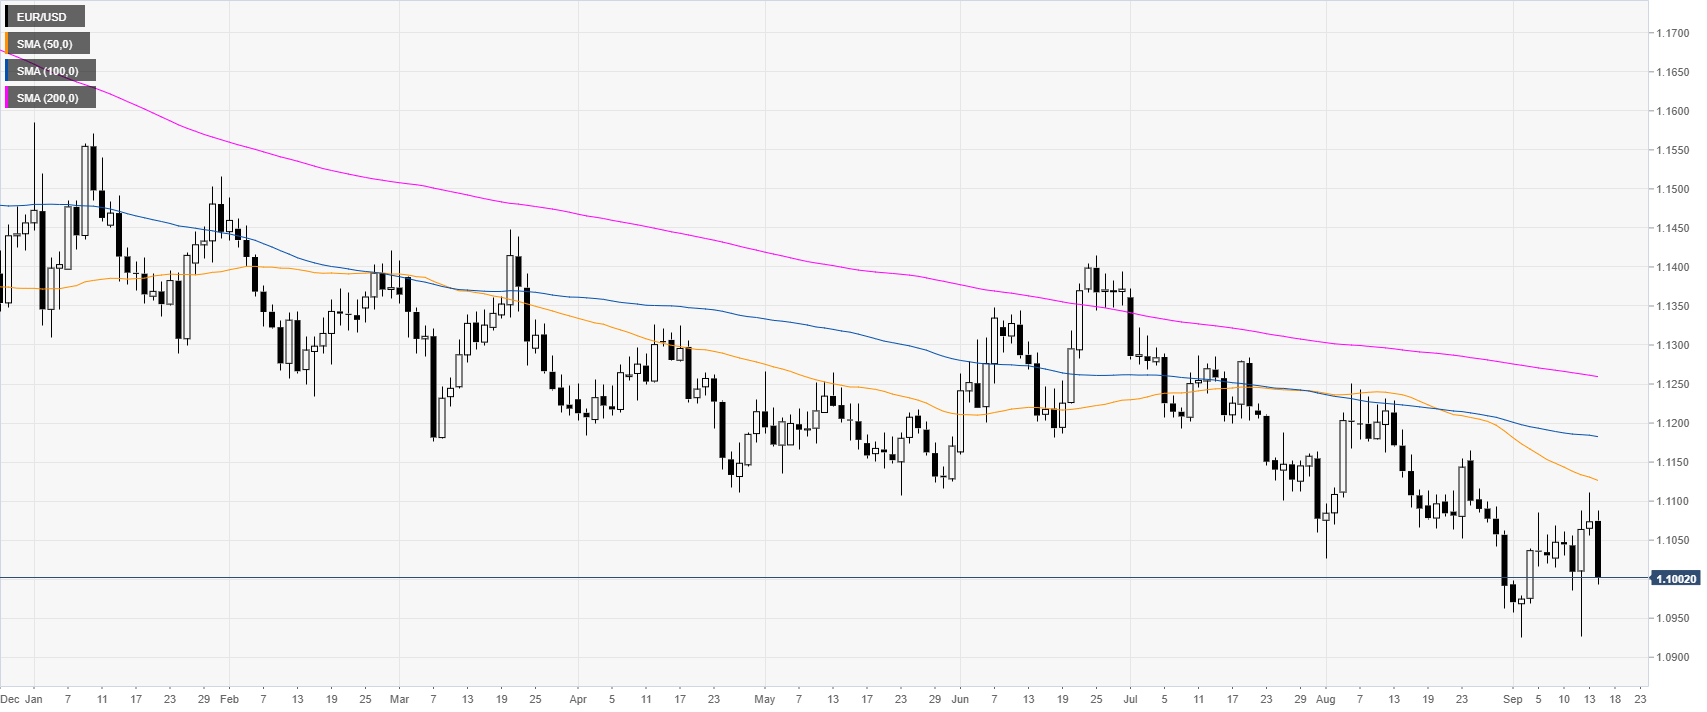
EUR/USD daily chart
The common currency, on the daily chart, is trading in a bear trend below its main daily simple moving averages (DSMAs). On Tuesday, the market will pay attention to the German ZEW survey and further down the week, traders will be watching for the FOMC on Wednesday.
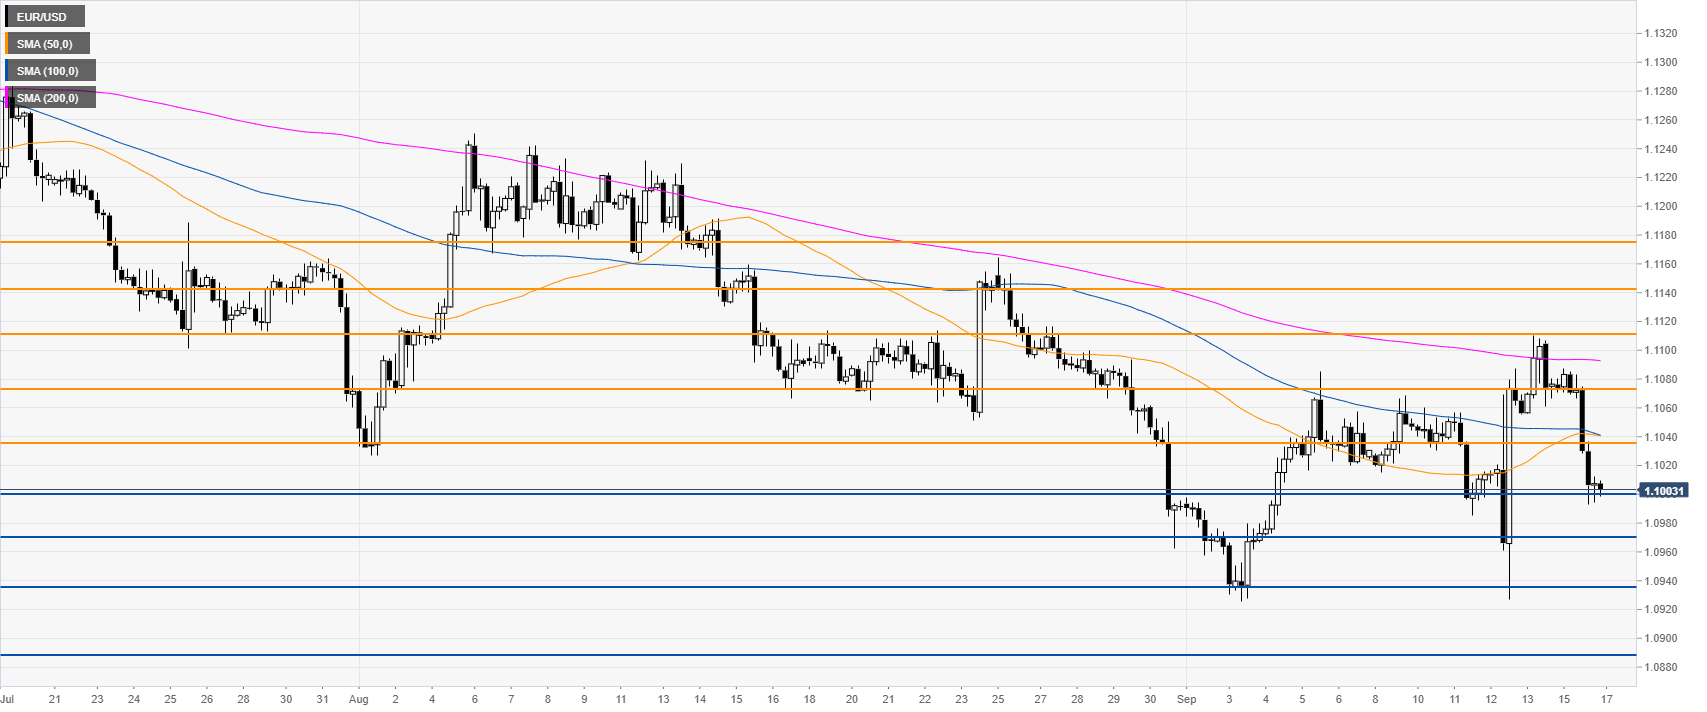
EUR/USD four-hour chart
The Fiber is under pressure hovering above the 1.1000 figure and below the main SMAs. If the market break through the 1.1000 figure, EUR/USD can weaken towards 1.0970 and 1.0935, according to the Technical Confluences Indicator.
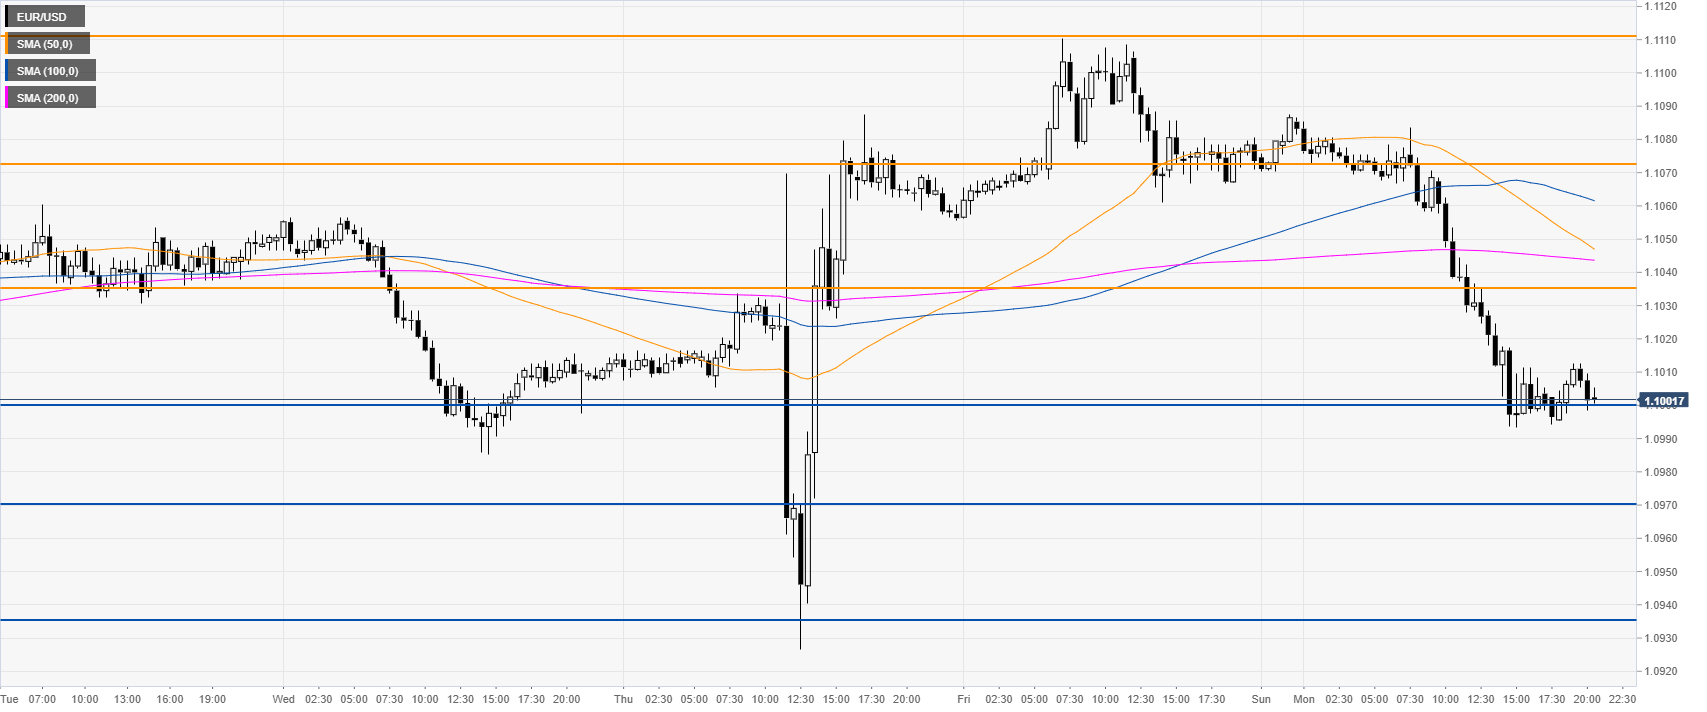
EUR/USD 30-minute chart
EUR/USD is under pressure near daily lows as the bears were relentless throughout the day. Immediate resistance is at the 1.1036 price level and then at 1.1072.
Additional key levels
Author

Flavio Tosti
Independent Analyst
More from Flavio Tosti


