|

EUR/USD technical analysis: Euro rolling into the Asian session below the 1.1050 level

  • EUR/USD is ending its fourth day of consolidation. 
  • The key level to beat for sellers is the 1.1020 support level.
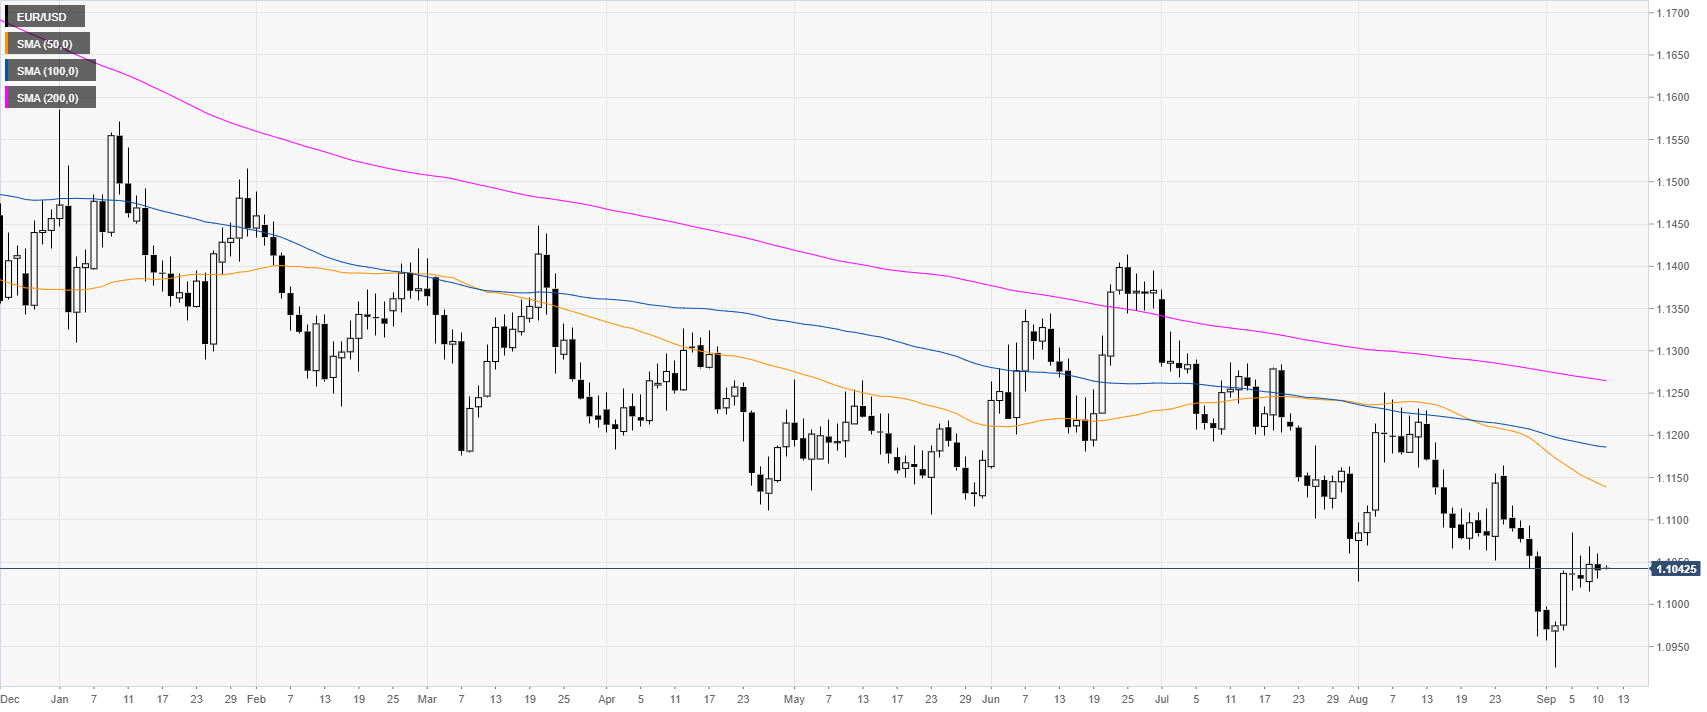


EUR/USD daily chart

 
On the daily time-frame, the single currency is trading in a bear trend below the main daily simple moving averages (DSMAs). This Tuesday, the market has been consolidating for the fourth consecutive day ahead of Wednesday’s Producer Price Index in the United States and most importantly the European Central Bank (ECB) meeting taking place on Thursday. 

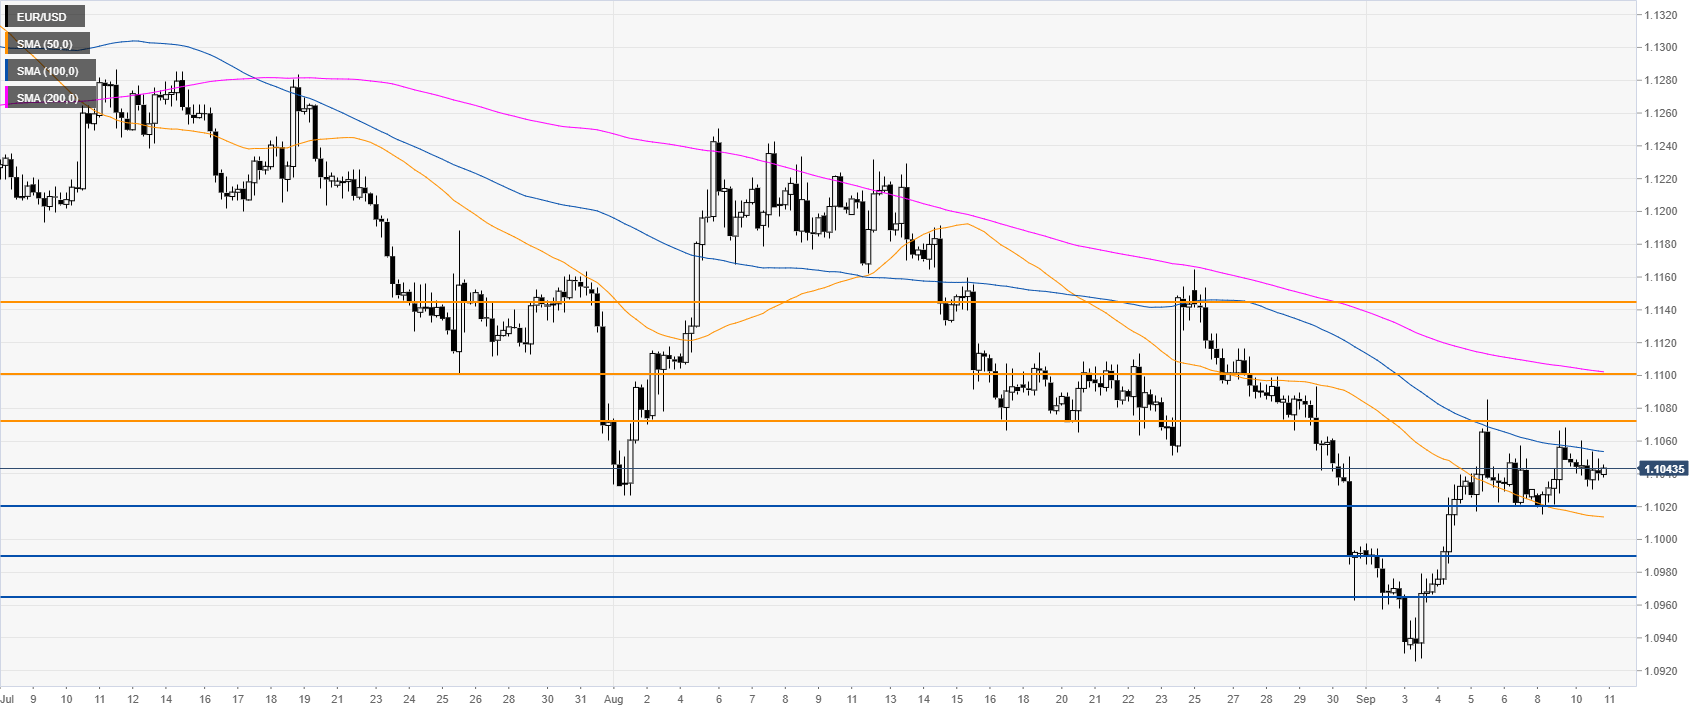
EUR/USD four-hour chart

 
EUR/USD is in a range between the 1.1020 and 1.1073 price level. The Euro is trading below the descending 100 and 200 SMAs, suggesting bearish momentum in the medium term. Bears will be looking for a break of the 1.1020 support to potentially drive the market south towards 1.0990 and 1.0964 price levels, according to the Technical Confluences Indicator.


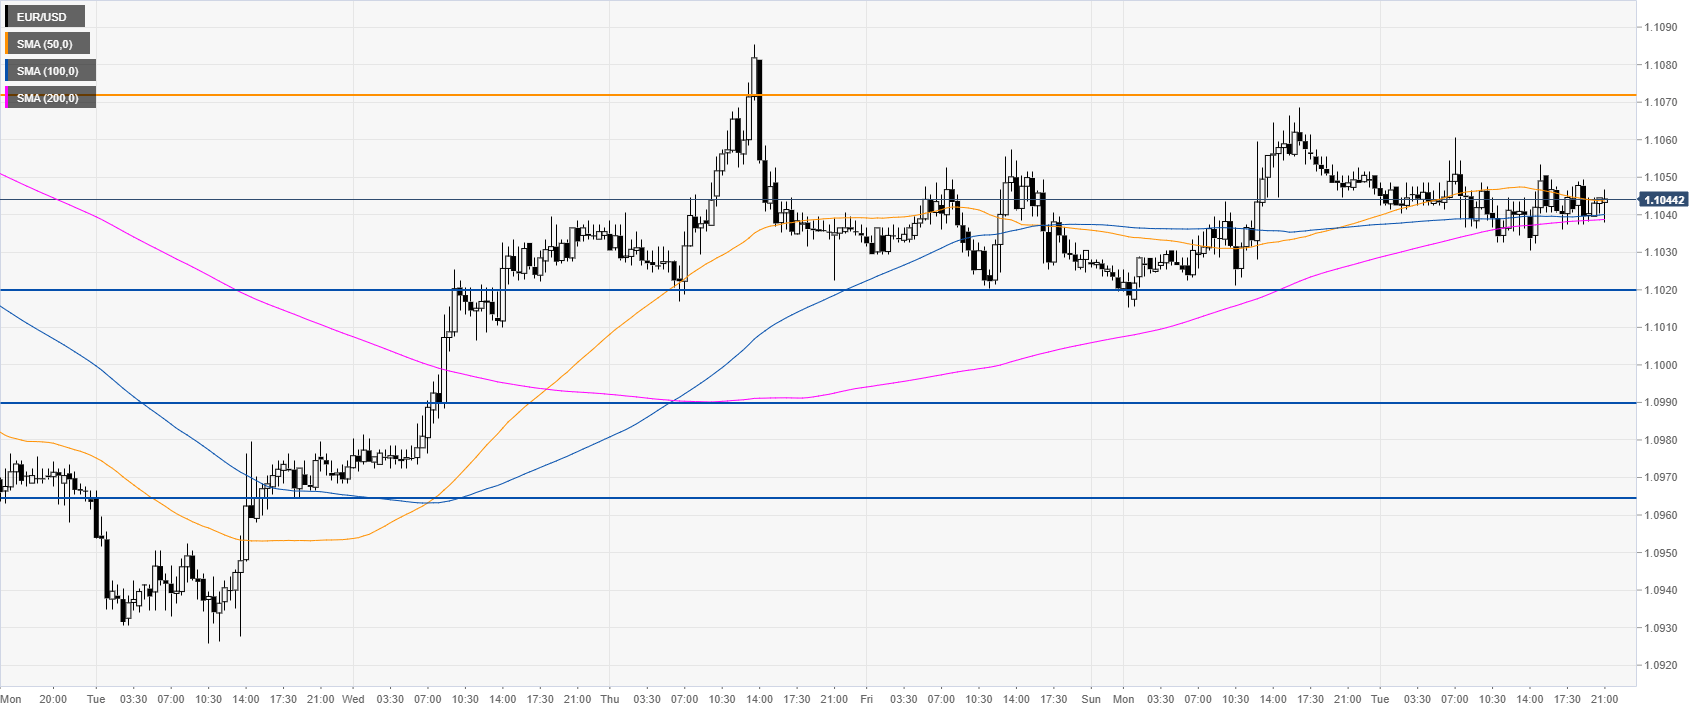
EUR/USD 30-minute chart

 
EUR/USD is trading in a very tight range as the spot spent most of the day between the SMAs. In order to attract further buying interest, the bulls would need a daily close above 1.1073 resistance. 

Additional key levels

EUR/USD

Overview
Today last price1.1043
Today Daily Change-0.0004
Today Daily Change %-0.04
Today daily open1.1047
 
Trends
Daily SMA201.107
Daily SMA501.1148
Daily SMA1001.1189
Daily SMA2001.1268
Levels
Previous Daily High1.1068
Previous Daily Low1.1016
Previous Weekly High1.1085
Previous Weekly Low1.0926
Previous Monthly High1.1251
Previous Monthly Low1.0962
Daily Fibonacci 38.2%1.1048
Daily Fibonacci 61.8%1.1036
Daily Pivot Point S11.1019
Daily Pivot Point S21.0991
Daily Pivot Point S31.0967
Daily Pivot Point R11.1072
Daily Pivot Point R21.1096
Daily Pivot Point R31.1124

Author

Flavio Tosti

Flavio Tosti

Independent Analyst


More from Flavio Tosti
Share:

Editor's Picks

EUR/USD looks apathetic around 1.1770

EUR/USD comes under renewed pressure on Tuesday, deflating below the 1.1800 support and reversing two consecutive days of gains. The pair’s decline follows the persistent move higher in the US Dollar, as trade uncertainty dominates the sentiment ahead of President Trump’s SOTU speech.

GBP/USD regains 1.3500 and above

GBP/USD extends its advance for the third day in a row on Tuesday, this time retesting the area beyond the 1.3500 hurdle. Cable’s uptick comes despite decent gains in the Greenback and the dovish message from the BoE’s Bailey at the UK Parliament.

Gold appears offered around $5,150

Gold is giving back a good portion of the recent multi-day rally, receding to the $5,150 zone per troy ounce amid the decent bounce in the US Dollar and mixed US Treasuty yields. In the meantime, markets’ attention remain on upcoming comments from Fed speakers.

Ripple’s DeFi shift in focus: Navigating XRPL EVM sidechain growth, XRPFi migration and liquidity

Ripple (XRP) has continued to trade under pressure, extending its decline by approximately 63% from the record high of $3.66 in July. The remittance token is trading above support at $1.35, while its upside appears limited by key supply zones, starting with $1.40, at the time of writing on Tuesday.

The Citrini report: How a debatable AI narrative can shake Wall Street

That AI-related headline alone was enough to rattle investors.US stocks slid sharply on Monday after a widely circulated Citrini Research memo outlined a hypothetical “2028 Global Intelligence Crisis”, warning that rapid AI adoption could push US unemployment into double digits as early as by mid-2028.

XRP pressured by weak ETF flows and declining retail interest

Ripple (XRP) is edging lower, trading above its intraday low of $1.32 at the time of writing on Tuesday. The decline from its weekly opening of $1.39 reflects heightened volatility in the broader cryptocurrency market, accentuated by tariff-triggered uncertainty.