|

EUR/USD technical analysis: Euro records its worst weekly decline since August

  • EUR/USD has been under heavy selling pressure throughout the all week. 
  • Bears are likely eyeing the 1.1000 handle on the way down. 
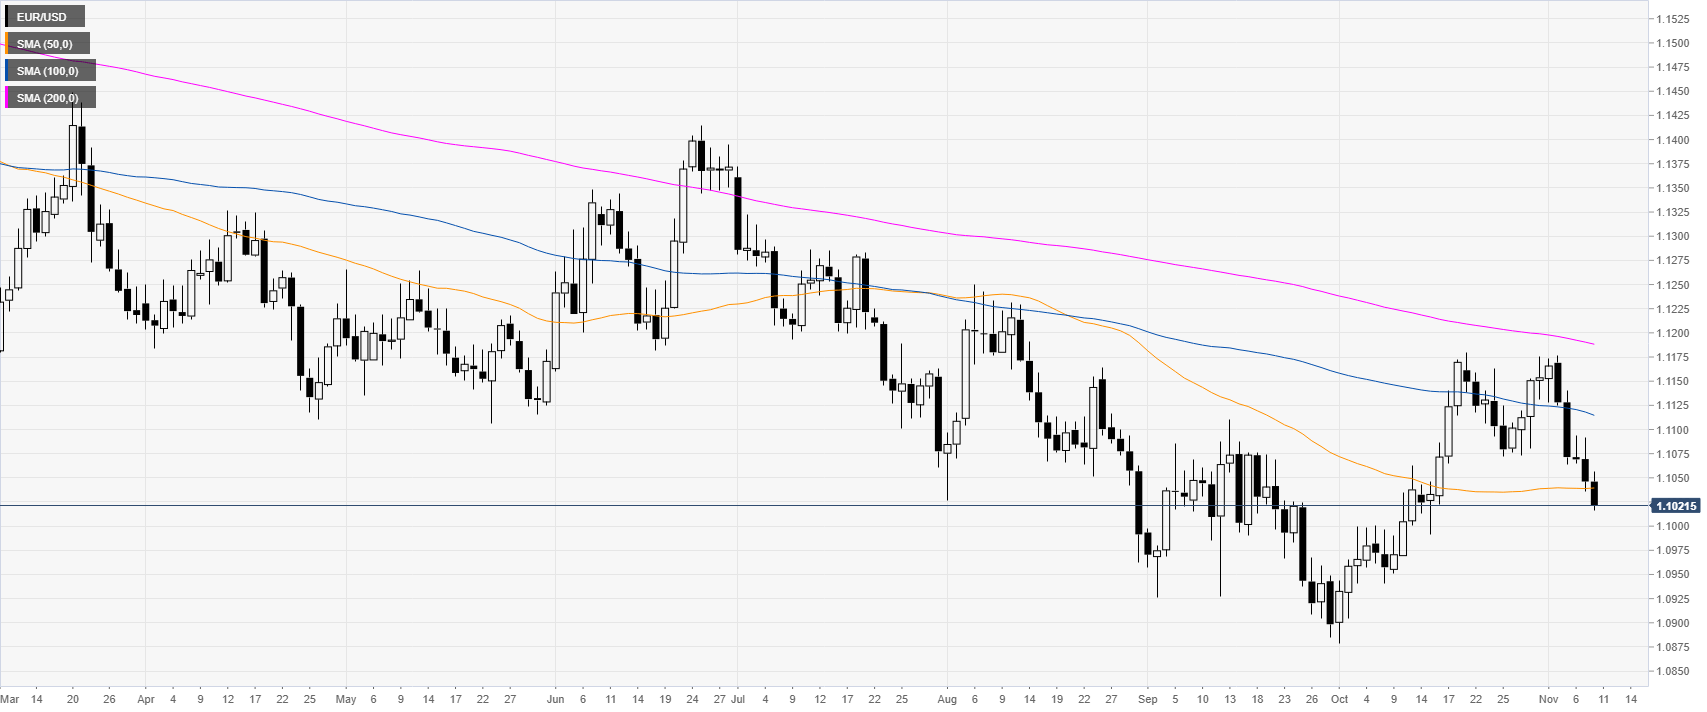
 

EUR/USD daily chart

 
The Euro, on the daily chart, is trading in a bear trend below its main daily simple moving averages (DMAs). The Fiber is registering its worst weekly decline since late August 2019.
 

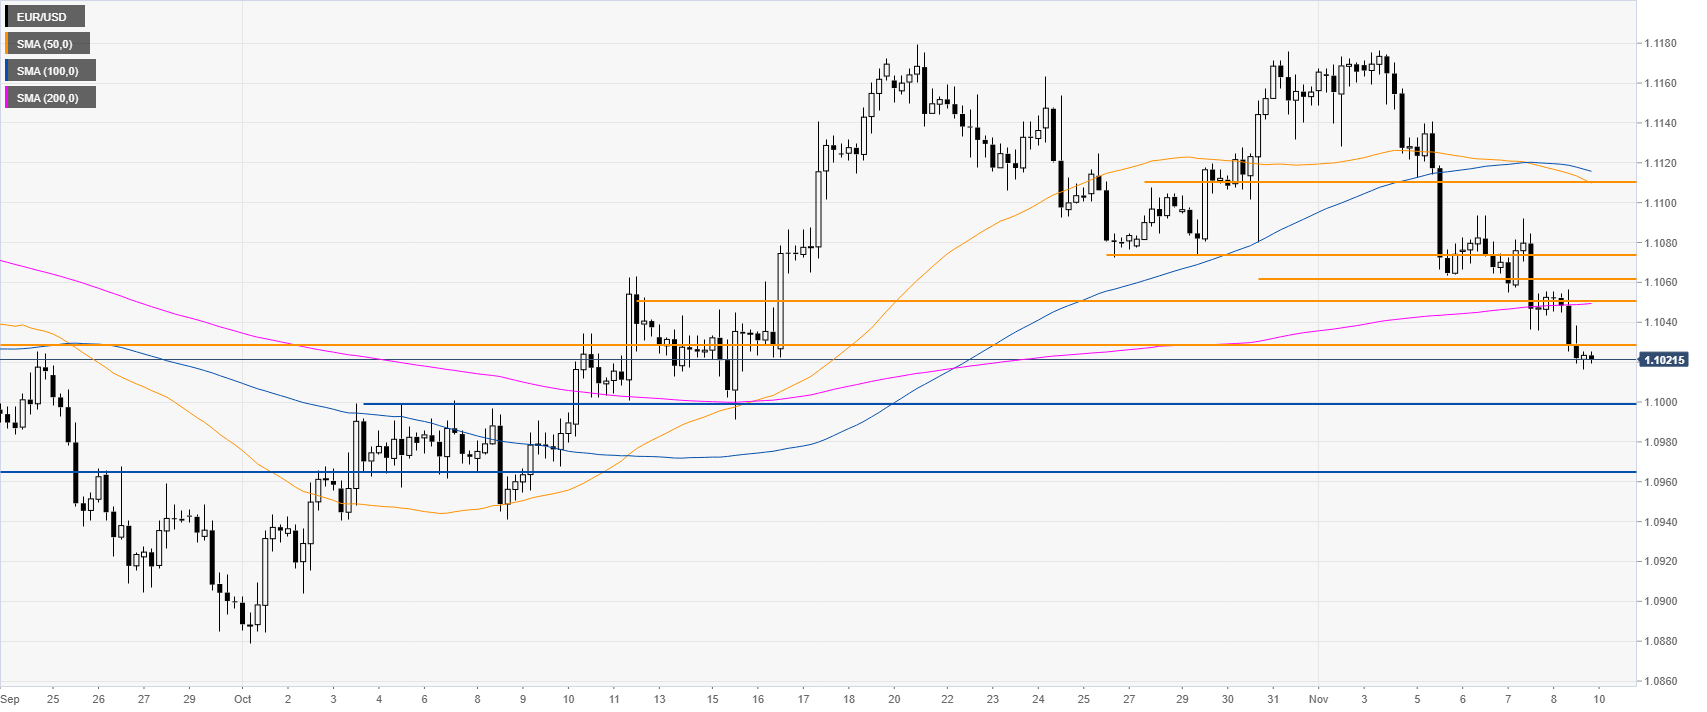
EUR/USD four-hour chart

 
The Fiber is trading below its main SMAs on the four-hour chart suggesting a bearish bias in the medium term. Bears broke below the 1.1028 support level which is opening the way to further potential weakness towards the 1.1000 figure and to the 1.0965 price level steam, according to the Technical Confluences Indicator. 
 

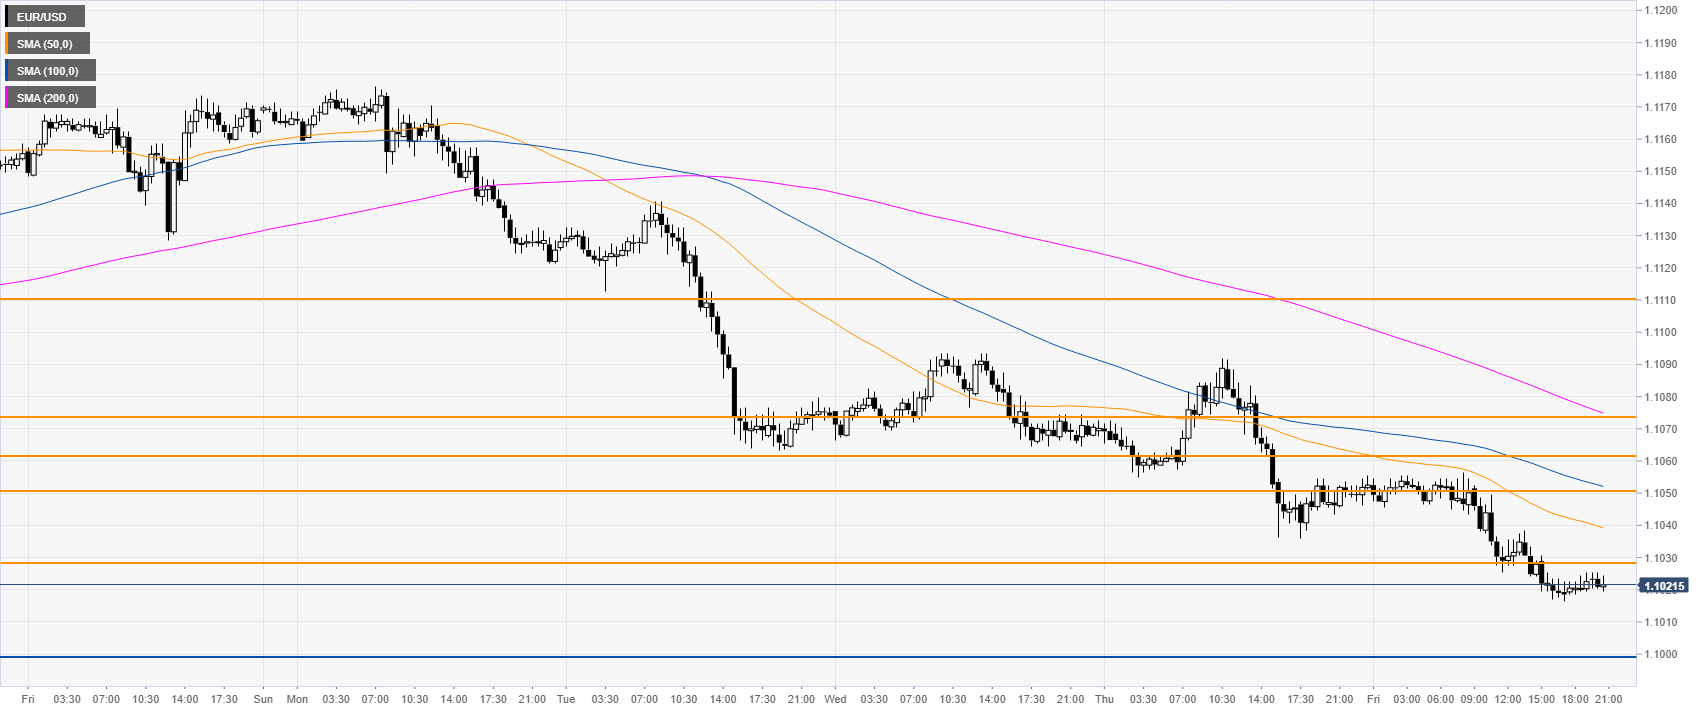
EUR/USD 30-minute chart

 
EUR/USD is under pressure below the main SMAs, suggesting a bearish bias in the near term. The 1.1028 and 1.1051 levels should act as resistance as well as the 1.1063/74 resistance zone, according to the Technical Confluences Indicator.


Additional key levels

EUR/USD

Overview
Today last price1.1022
Today Daily Change-0.0024
Today Daily Change %-0.22
Today daily open1.1046
 
Trends
Daily SMA201.1102
Daily SMA501.104
Daily SMA1001.1119
Daily SMA2001.1191
 
Levels
Previous Daily High1.1092
Previous Daily Low1.1036
Previous Weekly High1.1176
Previous Weekly Low1.1074
Previous Monthly High1.118
Previous Monthly Low1.0879
Daily Fibonacci 38.2%1.1057
Daily Fibonacci 61.8%1.107
Daily Pivot Point S11.1024
Daily Pivot Point S21.1002
Daily Pivot Point S31.0968
Daily Pivot Point R11.108
Daily Pivot Point R21.1114
Daily Pivot Point R31.1136

Author

Flavio Tosti

Flavio Tosti

Independent Analyst


More from Flavio Tosti
Share:

Editor's Picks

EUR/USD climbs to daily highs near 1.1820

EUR/USD now picks up pace and advances to the area of daily peaks north of the 1.1800 barrier at the end of the week. The pair’s decent move higher comes against the backdrop of a generalised lack of direction in the FX galaxy and the mild offered stance in the US Dollar.

GBP/USD trims losses, retests 1.3460

After briefly challenging its key 200-day SMA near 1.3440, GBP/USD now manages to regain some balance and revisit the 1.3460 zone on Friday. Cable’s pullback comes as the selling pressure on the Greenback gathers traction, reigniting some recovery in the risk-linked space.

Gold flirts with four-week highs past $5,200

Gold extends its rebound, climbing for a third consecutive session and pushing back above the $5,200 mark per troy ounce on Friday. The move higher continues to draw support from lingering geopolitical tensions and the ongoing uncertainty surrounding US trade policy, both of which are keeping safe-haven demand firmly in play.

Bitcoin, Ethereum and Ripple consolidate with short-term cautious bullish bias

Bitcoin, Ethereum and Ripple are consolidating near key technical areas on Friday, showing mild signs of stabilization after recent volatility. BTC holds above $67,000 despite mild losses so far this week, while ETH hovers around $2,000 after a rejection near its upper consolidation boundary. 

Changing the game: International implications of recent tariff developments

The Supreme Court ruling on International Emergency Economic Powers Act (IEEPA) tariffs provides limited relief for the rest of the world, with weighted average tariff rates modestly lower.

Starknet unveils strkBTC, shielded Bitcoin transactions on Ethereum Layer 2

Starknet, the Ethereum Layer 2 network developed by StarkWare, today announced strkBTC, a wrapped Bitcoin asset that introduces optional shielding while preserving full DeFi composability.