|
EUR/USD technical analysis: Euro printing fresh weekly lows and breaking below the 1.1052 level
- EUR/USD is under heavy pressure after the release of the US Gross Domestic Product.
- Earlier, the Fiber had a bullish spike which covered the whole daily range after comments from ECB's Knot.
- The level to beat for bears is the 1.1052 support followed by the 1.1033 level.
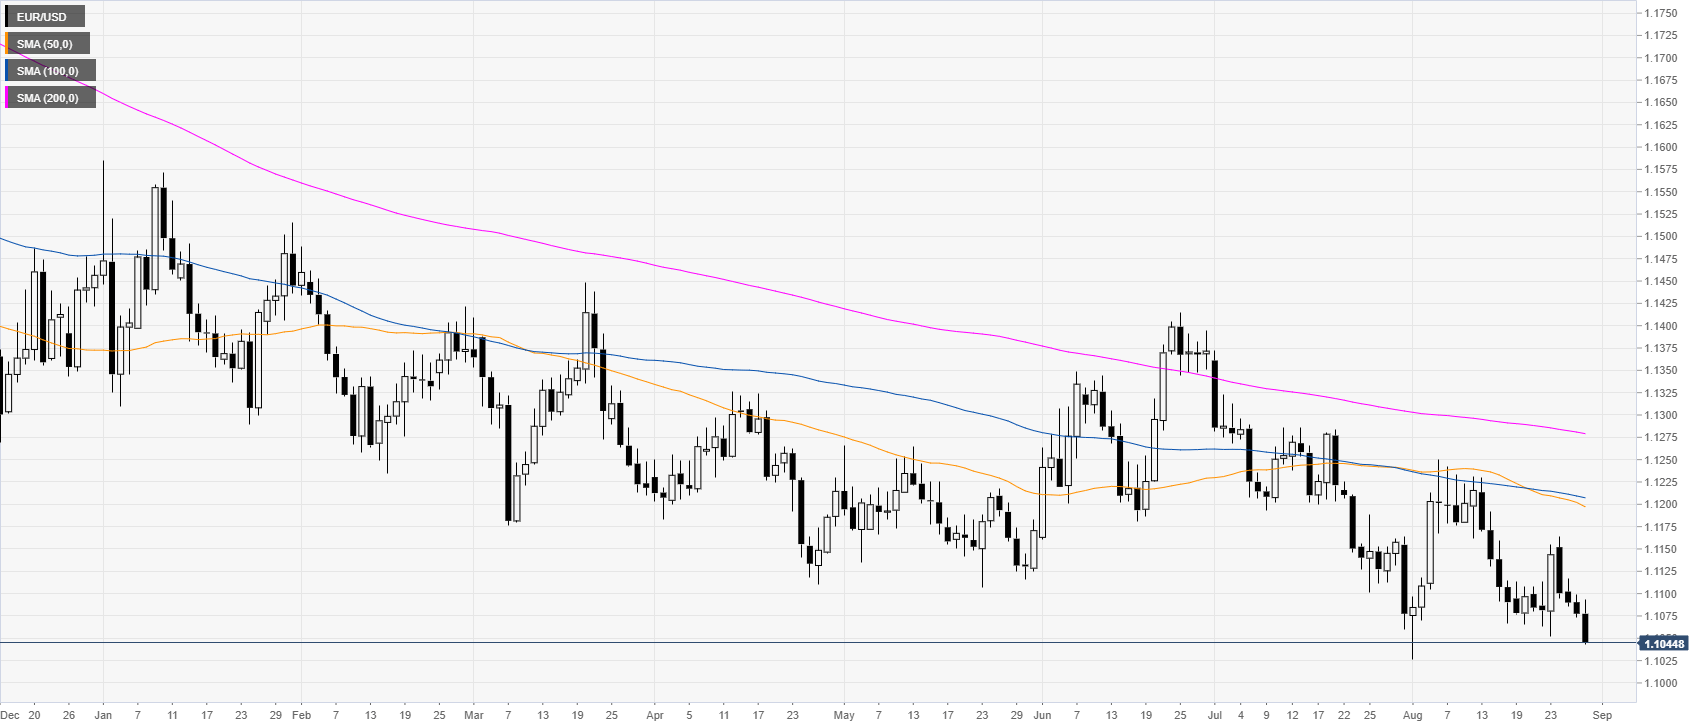
EUR/USD daily chart
On the daily time-frame, the single currency is trading in a bear trend below the main daily simple moving averages (DSMAs). Earlier in the New York session, the US Gross Domestic Product Annualized (GDP) came in line with expectations at 2% in the second quarter. In the London session, the German inflation in August (YoY) came below expectations at 1% vs. 1.2% forecast by analysts.
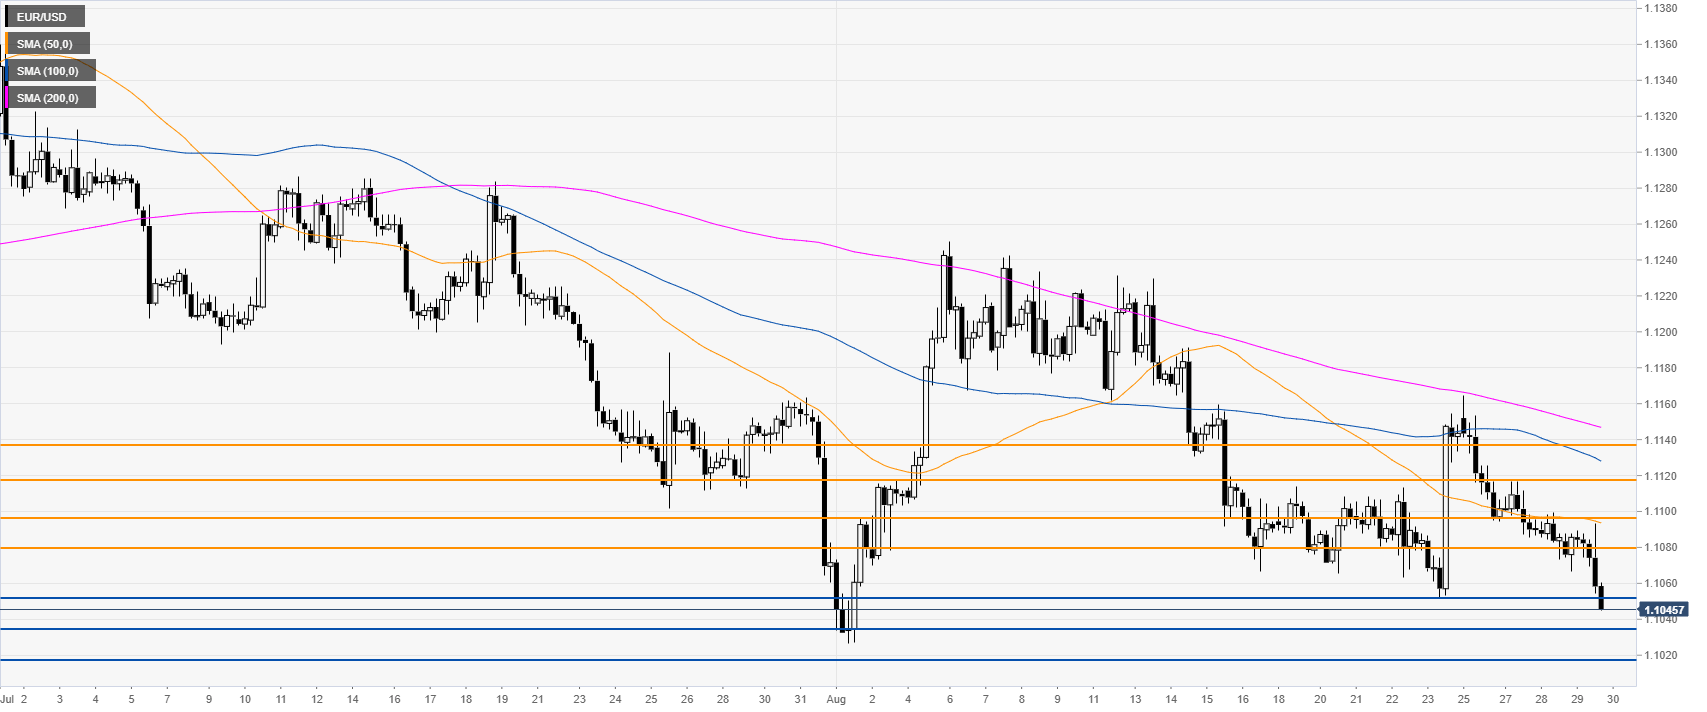
EUR/USD 4-hour chart
The Euro is under bearish pressure below the main SMAs as the market is printing new weekly lows. The spot is breaking below the 1.1052 support, which is leaving the door open for a potential move down towards 1.1033 and 1.1016 levels, according to the Technical Confluences Indicator.
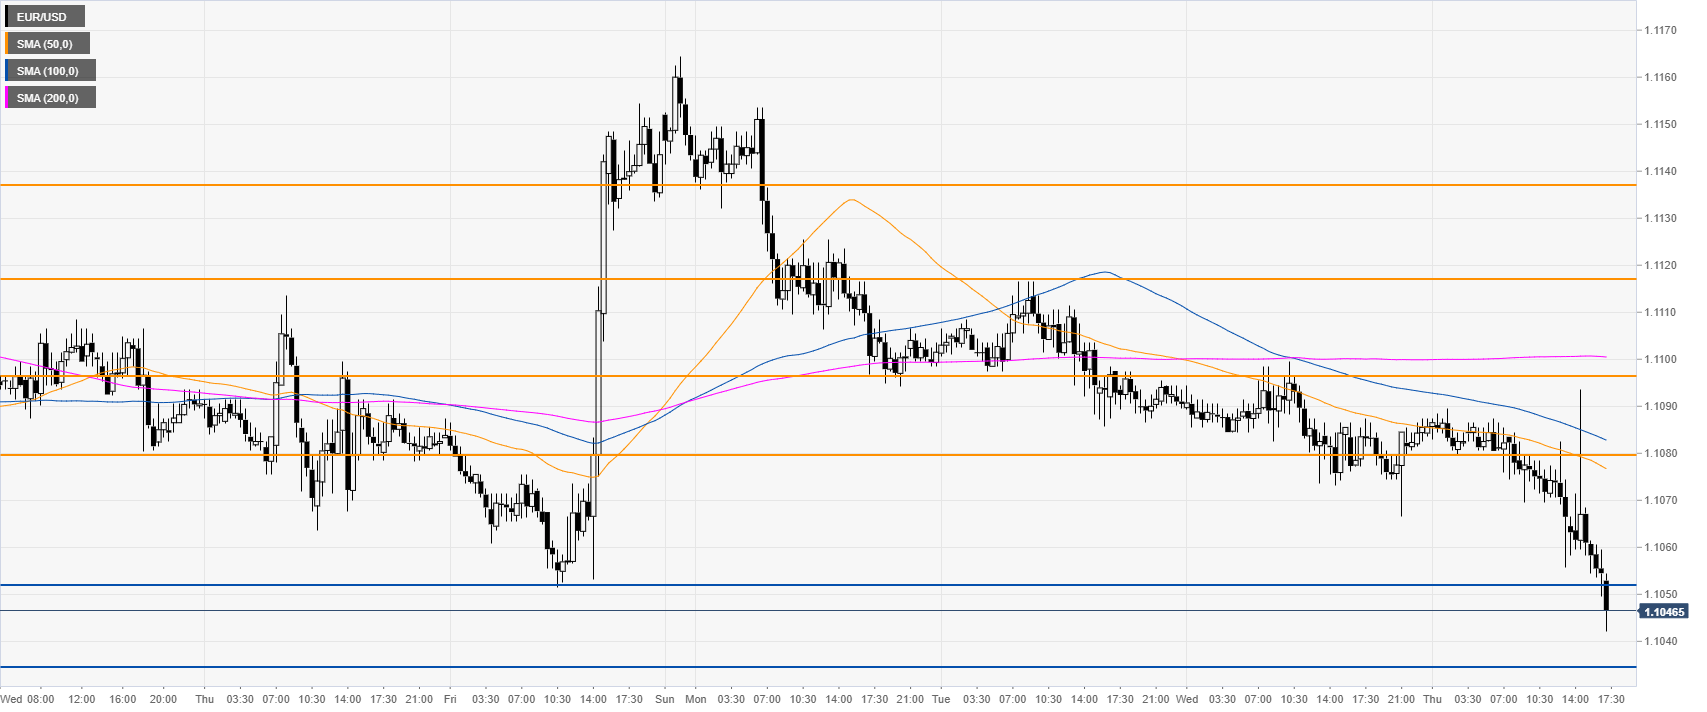
EUR/USD 30-minute chart
EUR/USD is trading below the main SMAs, suggesting a bearish momentum in the near term. Immediate resistances are seen at 1.1080, 1.1098 and 1.1117 levels, according to the Technical Confluences Indicator. Earlier in the New York session, the Fiber had a bullish spike which spanned the whole daily range only to be retraced minutes after. ECB's Knot said there was "no need to resume a Quantitative Easing program" and "the ECB's September meeting exactions are overdone."
Additional key levels
Author

Flavio Tosti
Independent Analyst
More from Flavio Tosti


