|

EUR/USD technical analysis: Euro hovering near weekly lows, sub-1.1160 level

  • EUR/USD is trading at weekly lows below the critical 1.1160 level.
  • The level to beat for bears is the 1.1136 support. 
 

EUR/USD daily chart

 
On the daily time-frame, the single currency is trading in a bear trend below its main daily simple moving averages (DSMAs). 


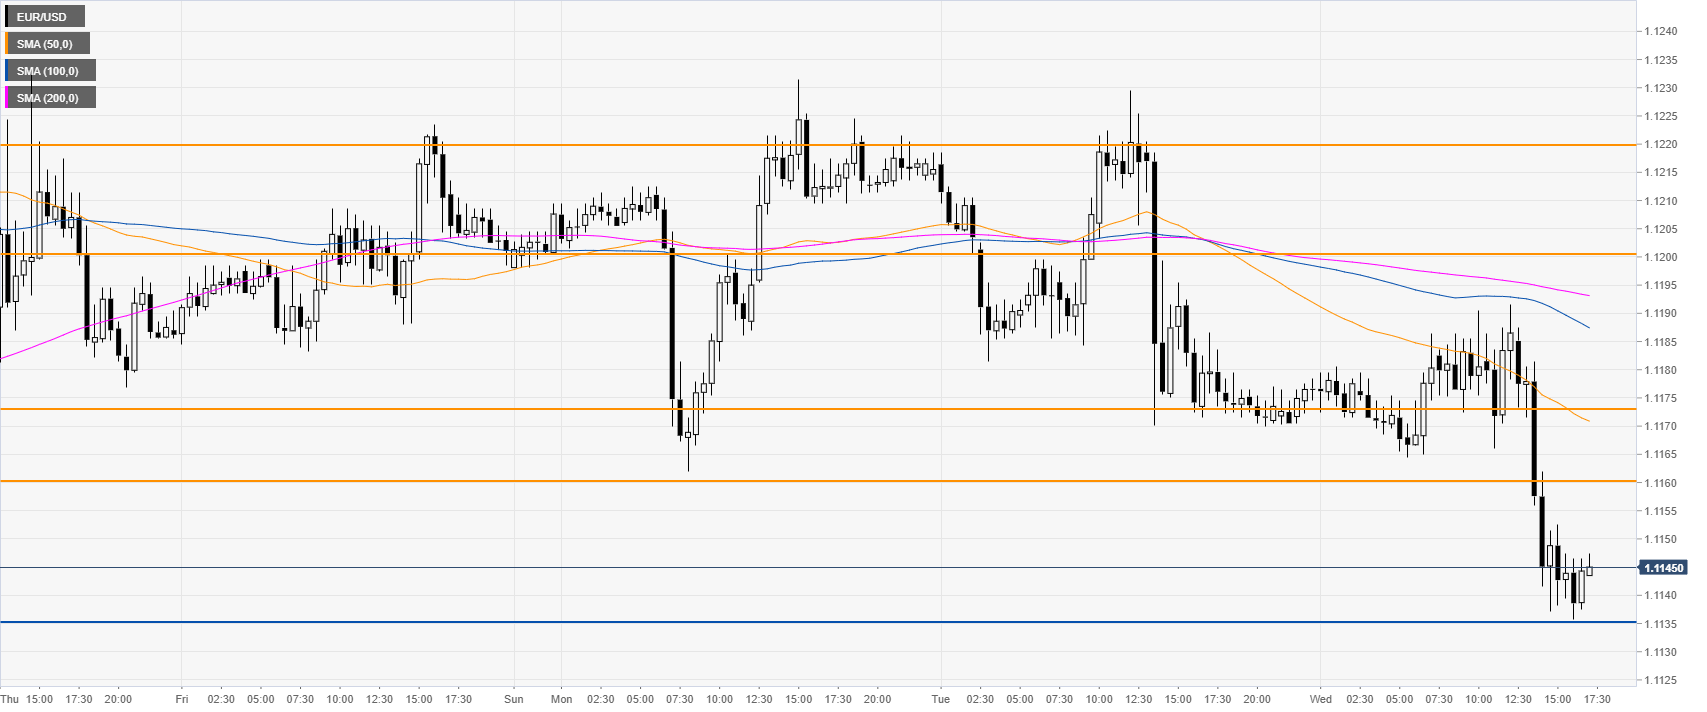
EUR/USD 4-hour chart

 
After six days of consolidation, EUR/USD finally broke below the 1.1160 support and the 100 SMA. The market reached the 1.1136 support, which becomes the level to beat for bears. The next supports on the way down are seen at the 1.1107, 1.1084 and 1.1061 levels.
 

EUR/USD 30-minute chart

 
The market is under bearish pressure below its main SMAs. Immediate resistances are seen at the 1.1160 and 1.1200 levels, according to the Technical Confluences Indicator


Additional key levels

EUR/USD

Overview
Today last price1.1144
Today Daily Change-0.0028
Today Daily Change %-0.25
Today daily open1.1172
 
Trends
Daily SMA201.1172
Daily SMA501.1238
Daily SMA1001.1224
Daily SMA2001.1295
Levels
Previous Daily High1.1229
Previous Daily Low1.117
Previous Weekly High1.1251
Previous Weekly Low1.1104
Previous Monthly High1.1373
Previous Monthly Low1.106
Daily Fibonacci 38.2%1.1193
Daily Fibonacci 61.8%1.1207
Daily Pivot Point S11.1151
Daily Pivot Point S21.1131
Daily Pivot Point S31.1092
Daily Pivot Point R11.1211
Daily Pivot Point R21.125
Daily Pivot Point R31.127

Author

Flavio Tosti

Flavio Tosti

Independent Analyst


More from Flavio Tosti
Share:

Editor's Picks

EUR/USD risks a deeper drop below 1.1750

EUR/USD keeps its vacillating mood in place as the the NA session drwas to a close on Tuesday, hovering below the 1.1800 hurdle amid acceptable gains in the US Dollar. In the meantime, market participants and the FX galaxy are expected to closely follow President Trump’s SOTU speech around 2AM GMT.
 

GBP/USD regains 1.3500 and above

GBP/USD extends its advance for the third day in a row on Tuesday, this time retesting the area beyond the 1.3500 hurdle. Cable’s uptick comes despite decent gains in the Greenback and the dovish message from the BoE’s Bailey at the UK Parliament.

Gold appears offered around $5,150

Gold is giving back a good portion of the recent multi-day rally, receding to the $5,150 zone per troy ounce amid the decent bounce in the US Dollar and mixed US Treasuty yields. In the meantime, markets’ attention remain on upcoming comments from Fed speakers.

Australia CPI to highlight persistent price pressures, backing a hawkish outlook

Australia will release its key set of inflation figures for the month of January on Wednesday, with the Consumer Price Index expected to rise by 3.7%, slightly lower than the 3.8% in the last month of 2025.

The Citrini report: How a debatable AI narrative can shake Wall Street

That AI-related headline alone was enough to rattle investors.US stocks slid sharply on Monday after a widely circulated Citrini Research memo outlined a hypothetical “2028 Global Intelligence Crisis”, warning that rapid AI adoption could push US unemployment into double digits as early as by mid-2028.

XRP pressured by weak ETF flows and declining retail interest

Ripple (XRP) is edging lower, trading above its intraday low of $1.32 at the time of writing on Tuesday. The decline from its weekly opening of $1.39 reflects heightened volatility in the broader cryptocurrency market, accentuated by tariff-triggered uncertainty.