|

EUR/USD technical analysis: Euro consolidating gains below 1.1400 resistance

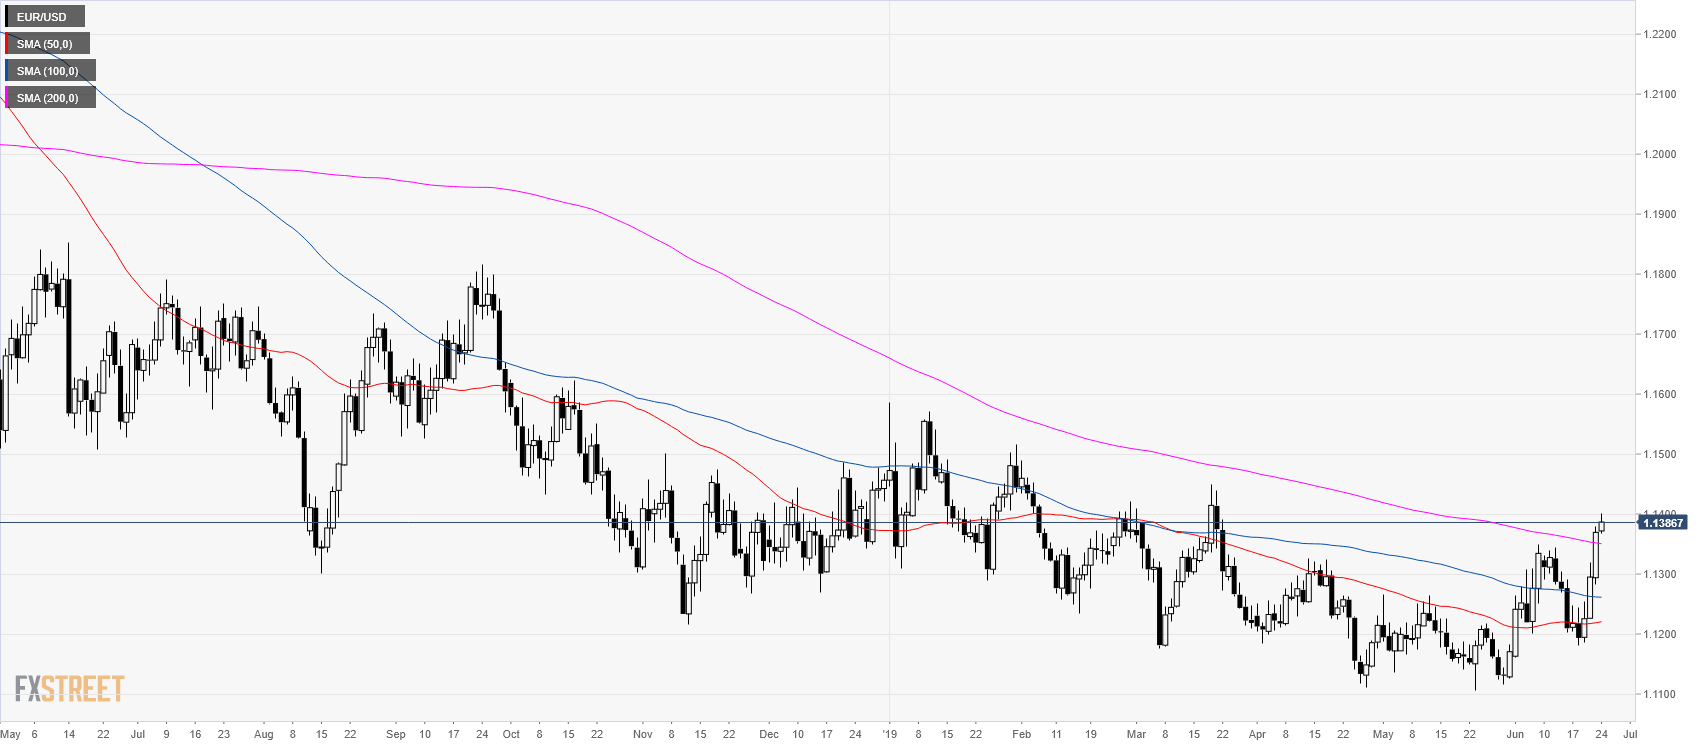
  • EUR/USD is turning bullish above its main daily simple moving averages.
  • The level to beat for bulls is the 1.1420 resistance. 

EUR/USD daily chart


EUR/USD is trading above its main daily simple moving averages suggesting that the trend is turning bullish.
EUR/USD 4-hour chart


The market is trading above its main SMAs suggesting bullish momentum. The market is finding some resistance at the 1.1400 level. The correction down can potentially extend to 1.1340 and 1.1310 support, according to the Technical Confluences Indicator


EUR/USD 30-minute chart


EUR/USD is trading above its main SMAs suggesting a bullish bias in the near term. According to the Technical Confluences Indicator, resistances are at 1.1400, 1.1420 and 1.1440 levels.


Additional key levels
 

EUR/USD

Overview
Today last price1.1384
Today Daily Change0.0015
Today Daily Change %0.13
Today daily open1.1369
 
Trends
Daily SMA201.1241
Daily SMA501.1219
Daily SMA1001.1262
Daily SMA2001.1352
Levels
Previous Daily High1.1378
Previous Daily Low1.1282
Previous Weekly High1.1378
Previous Weekly Low1.1181
Previous Monthly High1.1266
Previous Monthly Low1.1107
Daily Fibonacci 38.2%1.1342
Daily Fibonacci 61.8%1.1319
Daily Pivot Point S11.1308
Daily Pivot Point S21.1247
Daily Pivot Point S31.1212
Daily Pivot Point R11.1404
Daily Pivot Point R21.1439
Daily Pivot Point R31.15

Author

Flavio Tosti

Flavio Tosti

Independent Analyst


More from Flavio Tosti

Share:

Editor's Picks

GBP/USD revisits 1.3530; Dollar pushes harder

GBP/USD adds to the weekly correction and recedes toward the 1.3530 zone on Friday. Indeed, Cable faces increasing selling pressure on the back of extra gains in the Greenback, particularly fuelled by Chair Warsh’s speech at the Jackson Hole Symposium and the US NFP Annual Revision (-79K).

EUR/USD breaches below 1.1600, multi-day lows

EUR/USD now accelerates its decline and retreats to seven-day troughs in the sub-1.1600 region at the end of the week. The pair’s pullback comes on the back of the strong rebound in the US Dollar after Chair Warsh delivered a hawkish message in Jackson Hole, while the US NFP Annual Revision came in at -79K.

Gold challenges its 200-day SMA near $4,530

Gold’s decline gathers fresh steam, hitting weekly lows while disputing its critical 200-day SMA near $4,530 per troy ounce. The yellow metal’s increasing weakness comes in response to the generalised upbeat tone in the US Dollar and the widespread rebound in US Treasury yields, as investors continue to reprice a Fed rate hike in September.

Crypto Today: Bitcoin, Ethereum, XRP rally loses steam despite steady ETF inflows

Bitcoin is back below $80,000 at the time of writing on Friday, after a second attempt at breaking resistance between $81,000 and $82,000. Meanwhile, Ethereum and Ripple mirror Bitcoin’s cooling trend, with ETH sliding to $2,500 and XRP falling toward $1.40 support.

Week ahead – RBNZ and BoC decide on rates ahead of all-important US NFP

Dollar rebounds ahead of ISM PMI and NFP data. RBNZ is expected to raise rates; focus to fall on forward guidance. BoC is set to remain on hold; will it raise rates in 2027?

Diesel’s record $100 warning: The oil shock hiding in plain sight

The Oil market may look calmer than it did a few months ago, but diesel is sending a very different message. The US diesel crack spread, the premium of ultra-low sulphur diesel futures over WTI, recently surged above $100 per barrel for the first time, reaching an intraday record of just over $102.00.