|

EUR/USD Technical Analysis: Euro clings to eight-day's highs, 1.1093 resistance stays in focus

  • EUR/USD is clinging to the weekly gains into the London close.
  • The level to beat for buyers is the 1.1093 resistance. 
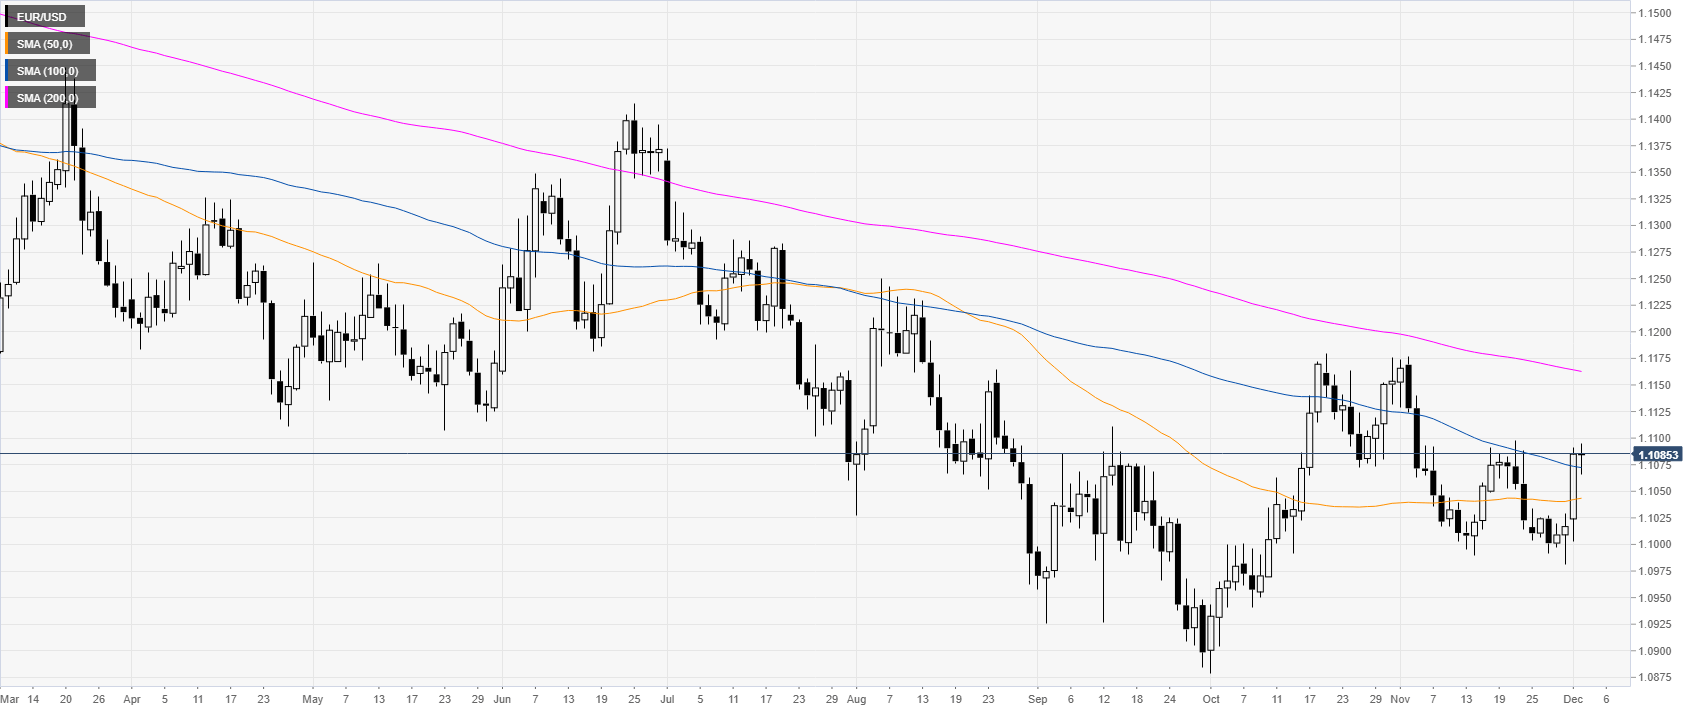
 

EUR/USD daily chart

 
EUR/USD on the daily chart is trading in a bear trend below its 200-day simple moving average (DMA). However, at the start very start of the week, the market had a massive reversal up above the 1.1000 handle and the 50/100 SMAs. 
 

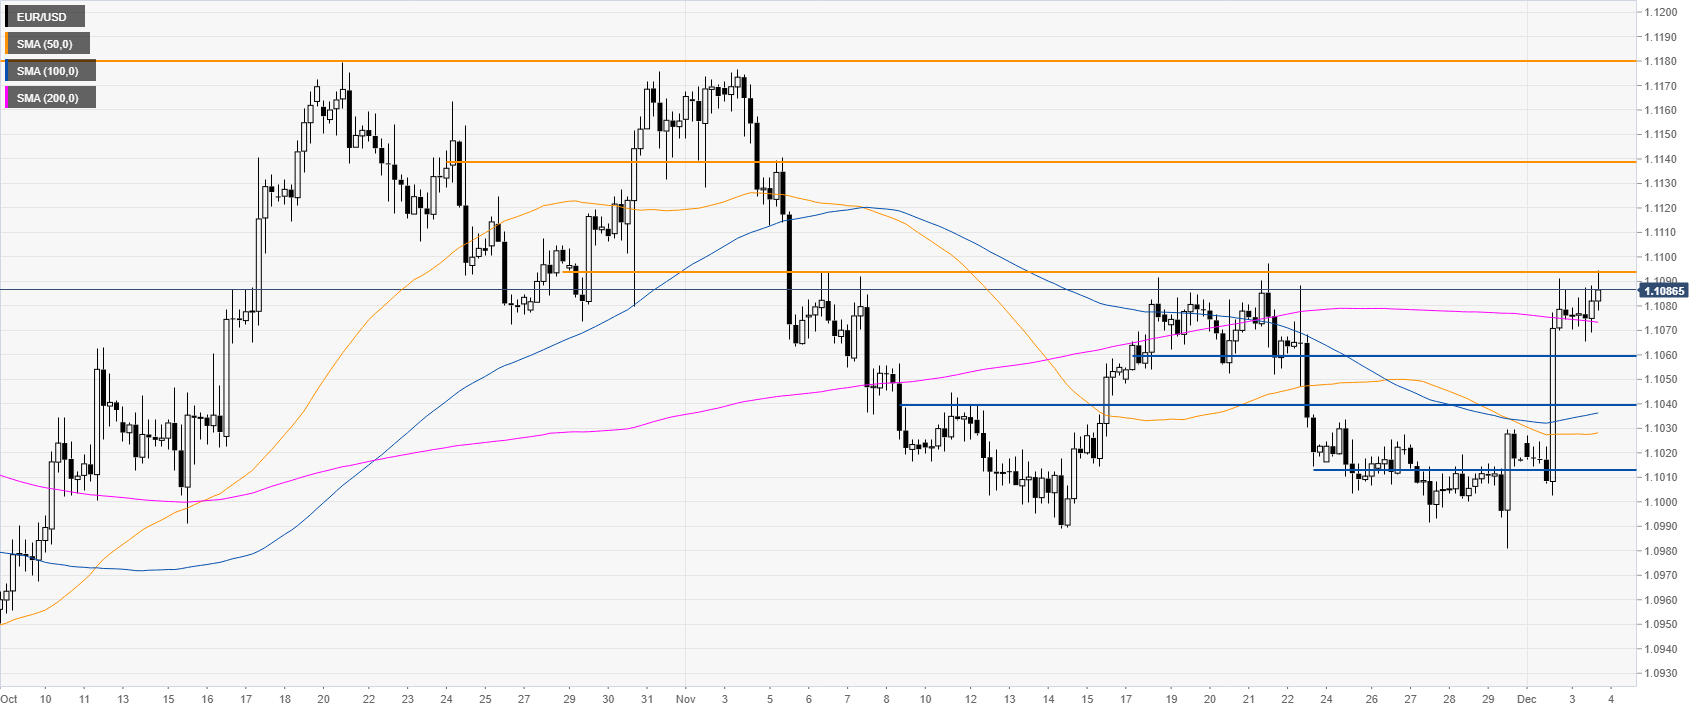
EUR/USD four-hour chart

 
EUR/USD is flirting with the 1.1093 resistance while holding above the 200 SMA. If the spot can overcome this critical resistance, EUR/USD could continue to climb towards the 1.1139 level and potentially up to 1.1180 in the medium term, according to the Technical Confluences Indicator
    

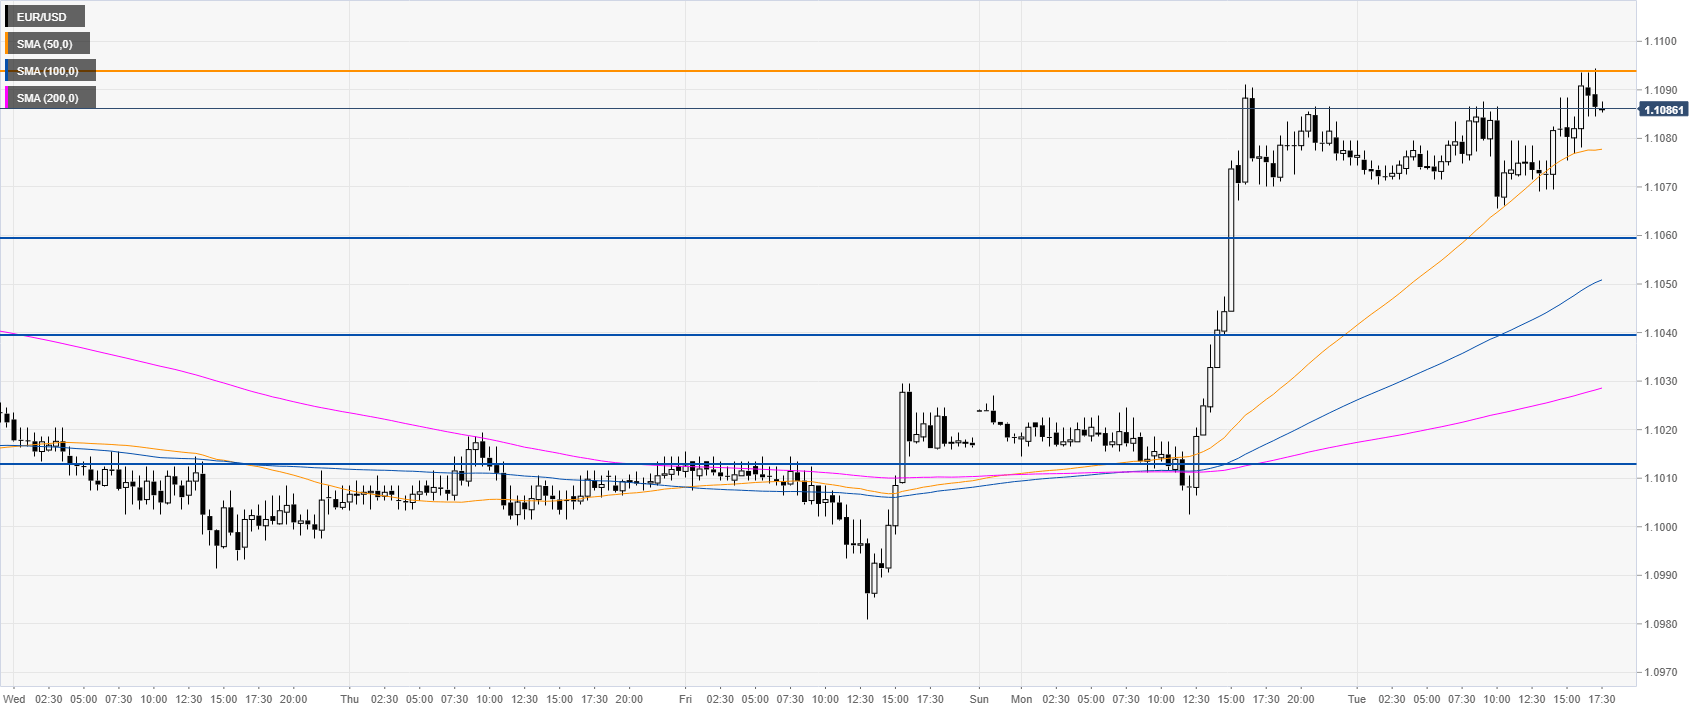
EUR/USD 30-minute chart

 
The spot had an above-average bullish breakout on the first day of the week. Support can be expected at the 1.1059, 1.1040 and 1.1013 price levels, according to the Technical Confluences Indicator. 
 

Additional key levels

EUR/USD

Overview
Today last price1.1086
Today Daily Change0.0001
Today Daily Change %0.01
Today daily open1.1085
 
Trends
Daily SMA201.1039
Daily SMA501.1043
Daily SMA1001.1074
Daily SMA2001.1164
 
Levels
Previous Daily High1.1091
Previous Daily Low1.1002
Previous Weekly High1.1034
Previous Weekly Low1.0981
Previous Monthly High1.1176
Previous Monthly Low1.0981
Daily Fibonacci 38.2%1.1057
Daily Fibonacci 61.8%1.1036
Daily Pivot Point S11.1028
Daily Pivot Point S21.0971
Daily Pivot Point S31.0939
Daily Pivot Point R11.1117
Daily Pivot Point R21.1148
Daily Pivot Point R31.1205

Author

Flavio Tosti

Flavio Tosti

Independent Analyst


More from Flavio Tosti
Share:

Editor's Picks

EUR/USD climbs to daily highs near 1.1820

EUR/USD now picks up pace and advances to the area of daily peaks north of the 1.1800 barrier at the end of the week. The pair’s decent move higher comes against the backdrop of a generalised lack of direction in the FX galaxy and the mild offered stance in the US Dollar.

GBP/USD trims losses, retests 1.3460

After briefly challenging its key 200-day SMA near 1.3440, GBP/USD now manages to regain some balance and revisit the 1.3460 zone on Friday. Cable’s pullback comes as the selling pressure on the Greenback gathers traction, reigniting some recovery in the risk-linked space.

Gold flirts with four-week highs past $5,200

Gold extends its rebound, climbing for a third consecutive session and pushing back above the $5,200 mark per troy ounce on Friday. The move higher continues to draw support from lingering geopolitical tensions and the ongoing uncertainty surrounding US trade policy, both of which are keeping safe-haven demand firmly in play.

Bitcoin, Ethereum and Ripple consolidate with short-term cautious bullish bias

Bitcoin, Ethereum and Ripple are consolidating near key technical areas on Friday, showing mild signs of stabilization after recent volatility. BTC holds above $67,000 despite mild losses so far this week, while ETH hovers around $2,000 after a rejection near its upper consolidation boundary. 

Breaking: US and Israel attack Iran, risk aversion to sweep global markets

Early Saturday, United States (US) President Donald Trump announced that the US had begun “major combat operations” in Iran, following Israel’s pre-emptive missile attacks against Tehran.

Starknet unveils strkBTC, shielded Bitcoin transactions on Ethereum Layer 2

Starknet, the Ethereum Layer 2 network developed by StarkWare, today announced strkBTC, a wrapped Bitcoin asset that introduces optional shielding while preserving full DeFi composability.