EUR/USD Technical Analysis: Euro approaching 1.1300 figure as the US Dollar strengthens across the board

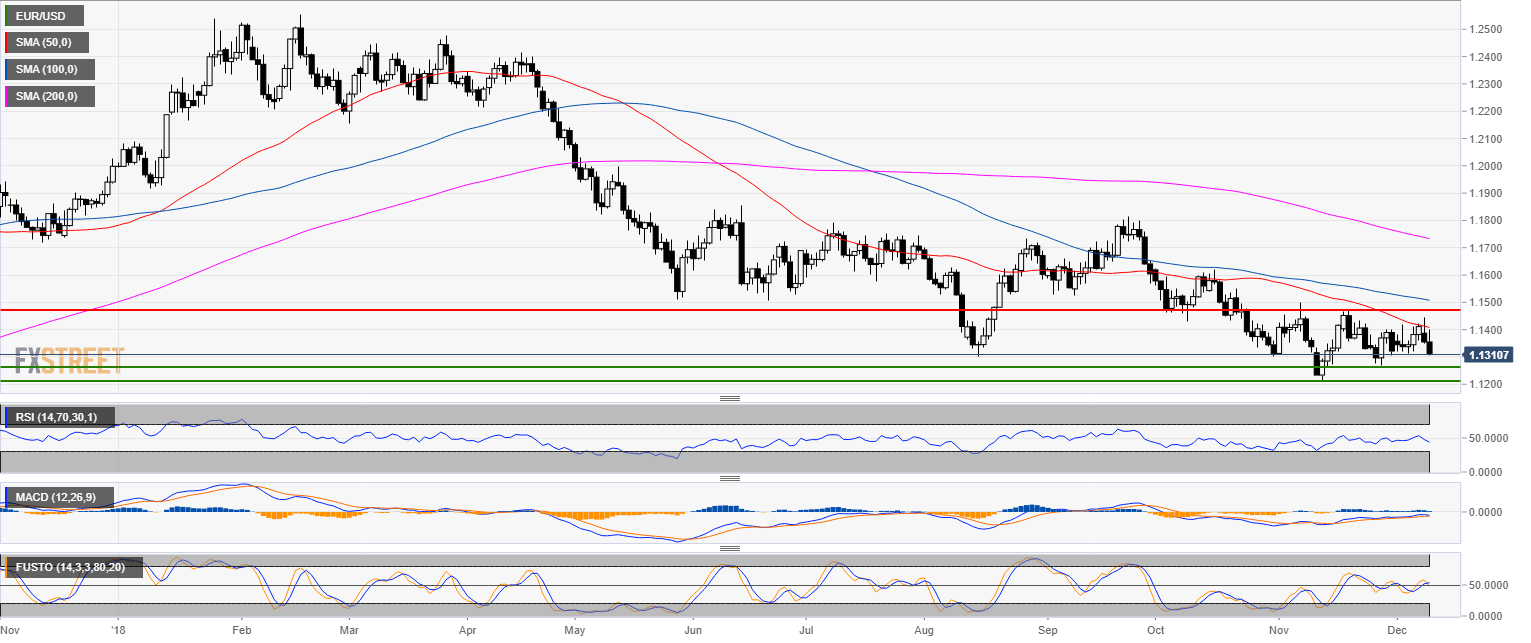
EUR/USD daily chart
- EUR/USD is trading in a bear trend below the 50, 100 and 200-day simple moving average (SMA).
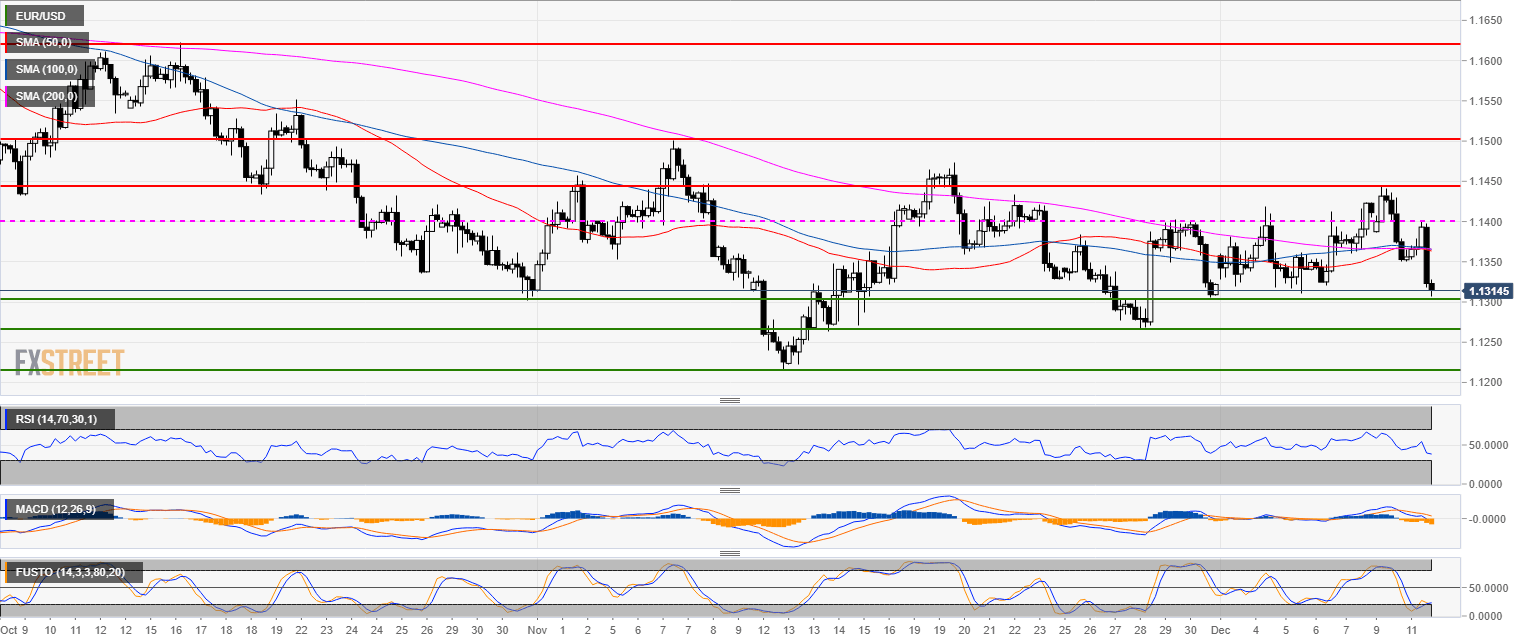
EUR/USD 4-hour chart
- EUR/USD is currently trading below its main SMAs.
- EUR/USD is testing 1.1300 figure.
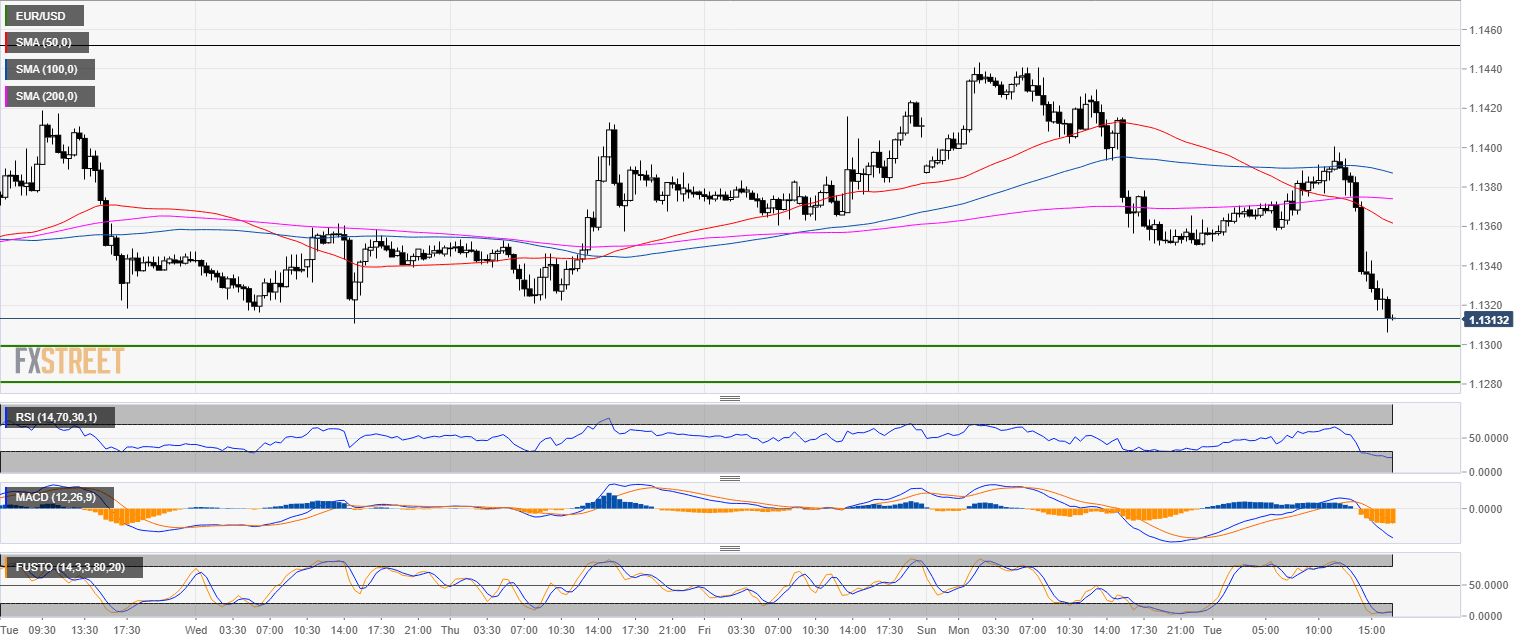
EUR/USD 30-minute chart
- EUR/USD is trading below its 200 SMA.
- In the short-term, if EUR/USD breaks below 1.1300 the next destination should be the 1.1280 level.
Additional key levels
EUR/USD
Overview:
Today Last Price: 1.1314
Today Daily change: -41 pips
Today Daily change %: -0.361%
Today Daily Open: 1.1355
Trends:
Previous Daily SMA20: 1.1359
Previous Daily SMA50: 1.1413
Previous Daily SMA100: 1.1511
Previous Daily SMA200: 1.1738
Levels:
Previous Daily High: 1.1444
Previous Daily Low: 1.135
Previous Weekly High: 1.1424
Previous Weekly Low: 1.1311
Previous Monthly High: 1.15
Previous Monthly Low: 1.1216
Previous Daily Fibonacci 38.2%: 1.1386
Previous Daily Fibonacci 61.8%: 1.1408
Previous Daily Pivot Point S1: 1.1322
Previous Daily Pivot Point S2: 1.129
Previous Daily Pivot Point S3: 1.1229
Previous Daily Pivot Point R1: 1.1415
Previous Daily Pivot Point R2: 1.1476
Previous Daily Pivot Point R3: 1.1509
Author

Flavio Tosti
Independent Analyst


