|

EUR/USD Technical Analysis: Downside risk below 1.1360 level as bears are taking the lead
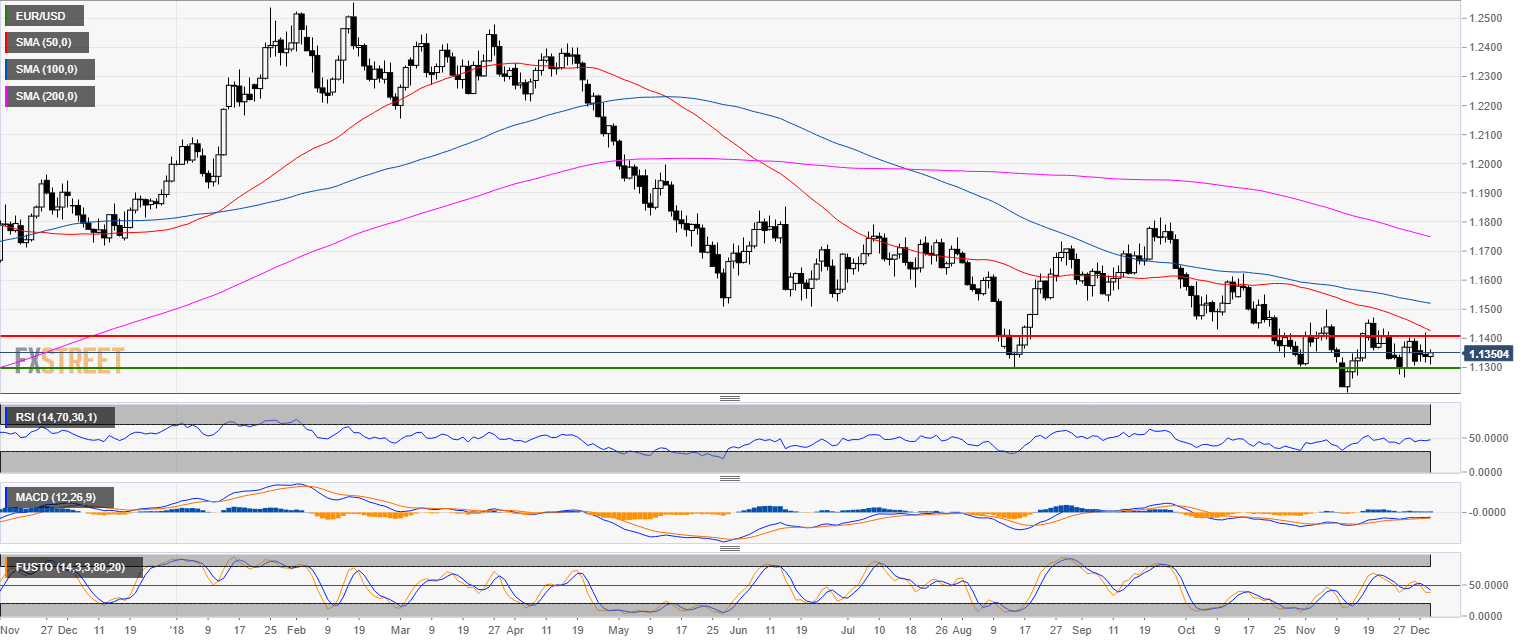
EUR/USD daily chart

  • EUR/USD is trading in a bear trend below the 200-day simple moving average (SMA).
  • EUR/USD is currently trapped between the 1.1300 and 1.1400 levels.

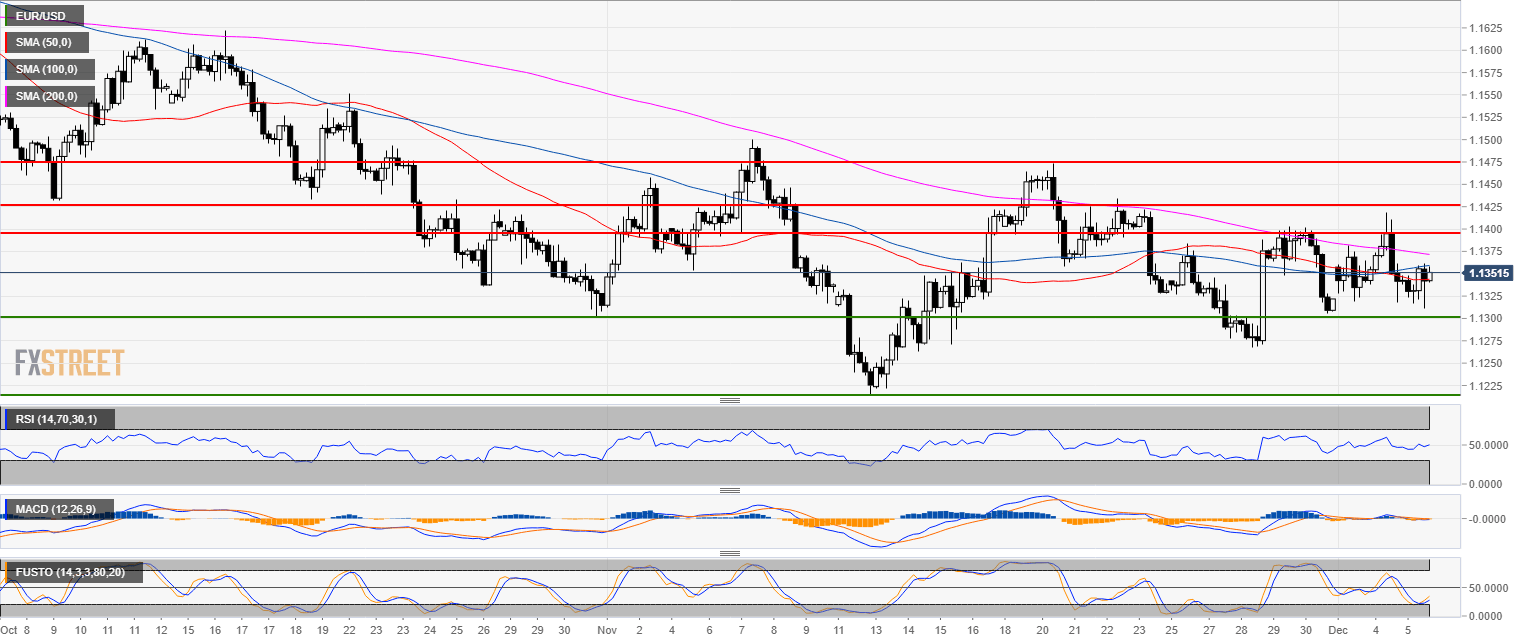
EUR/USD 4-hour chart

  • EUR/USD is trading in a neutral range but the downside risk is increasing. 

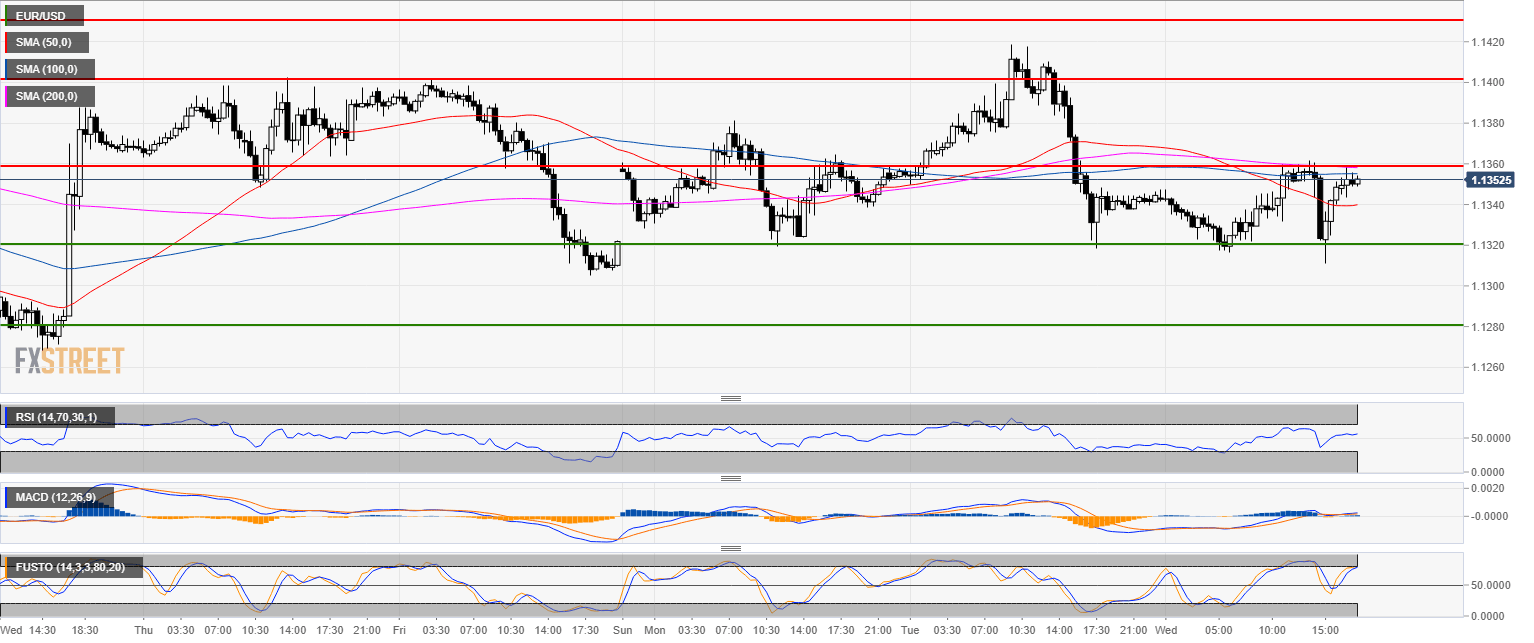
EUR/USD 30-minute chart

  • Once again, EUR/USD bumped into the 1.1360 resistance and the 200 SMA.
  • Failure to break above the level should lead to a slow grind to 1.1320 and possibly to 1.1280 by early Friday.

Additional key levels

EUR/USD

Overview:
    Today Last Price: 1.135
    Today Daily change: 12 pips
    Today Daily change %: 0.106%
    Today Daily Open: 1.1338
Trends:
    Previous Daily SMA20: 1.1353
    Previous Daily SMA50: 1.1434
    Previous Daily SMA100: 1.1523
    Previous Daily SMA200: 1.1755
Levels:
    Previous Daily High: 1.1419
    Previous Daily Low: 1.1318
    Previous Weekly High: 1.1402
    Previous Weekly Low: 1.1267
    Previous Monthly High: 1.15
    Previous Monthly Low: 1.1216
    Previous Daily Fibonacci 38.2%: 1.1357
    Previous Daily Fibonacci 61.8%: 1.138
    Previous Daily Pivot Point S1: 1.1298
    Previous Daily Pivot Point S2: 1.1258
    Previous Daily Pivot Point S3: 1.1197
    Previous Daily Pivot Point R1: 1.1398
    Previous Daily Pivot Point R2: 1.1459
    Previous Daily Pivot Point R3: 1.1499

Author

Flavio Tosti

Flavio Tosti

Independent Analyst


More from Flavio Tosti
Share:

Editor's Picks

EUR/USD recedes to daily lows near 1.1850

EUR/USD keeps its bearish momentum well in place, slipping back to the area of 1.1850 to hit daily lows on Monday. The pair’s continuation of the leg lower comes amid decent gains in the US Dollar in a context of scarce volatility and thin trade conditions due to the inactivity in the US markets.

GBP/USD resumes the downtrend, back to the low-1.3600s

GBP/USD rapidly leaves behind Friday’s decent advance, refocusing on the downside and retreating to the 1.3630 region at the beginning of the week. In the meantime, the British Pound is expected to remain under the microscope ahead of the release of the key UK labour market report on Tuesday.

Gold looks inconclusive around $5,000

Gold partially fades Friday’s strong recovery, orbiting around the key $5,000 region per troy ounce in a context of humble gains in the Greenback on Monday. Additing to the vacillating mood, trade conditions remain thin amid the observance of the Presidents Day holiday in the US.

Bitcoin consolidates as on-chain data show mixed signals

Bitcoin price has consolidated between $65,700 and $72,000 over the past nine days, with no clear directional bias. US-listed spot ETFs recorded a $359.91 million weekly outflow, marking the fourth consecutive week of withdrawals.

The week ahead: Key inflation readings and why the AI trade could be overdone

It is likely to be a quiet start to the week, with US markets closed on Monday for Presidents Day. European markets are higher across the board and gold is clinging to the $5,000 level after the tamer than expected CPI report in the US reduced haven flows to precious metals.

XRP steadies in narrow range as fund inflows, futures interest rise

Ripple is trading in a narrow range between $1.45 (immediate support) and $1.50 (resistance) at the time of writing on Monday. The remittance token extended its recovery last week, peaking at $1.67 on Sunday from the weekly open at $1.43.