EUR/USD staggers back from recent highs after Greenback bids resurface
- EUR/USD loses grip on 1.0900 on Tuesday after risk aversion reignites.
- Fed rate cut hopes have been pushed back to November.
- ECB rate cut, US NFP Friday loom darkly ahead.

EUR/USD declined around a quarter of a percent on Tuesday after market sentiment soured following US dataprints that pushed markets back into risk-off bids into the Greenback. US data failed to deliver signs of a steepening economic slowdown in the US, sending broad-market hopes for signs of Federal Reserve (Fed) rate cuts back to the bottom and sparking a fresh bout of risk-off safe haven bidding.
According to the CME’s FedWatch Tool, rate markets are still hoping for at least a quarter-point rate cut at the Fed’s September interest rate meeting. However, odds are tilted towards November fora first rate trim with probabilities pricing in 90% odds of a 25-basis point decline in Fed reference rates to the 500-525 range expected November 7.
The European Central Bank (ECB) is broadly expected to deliver a quarter-point cut when the ECB meets this week on Thursday. With the rate differential between the EUR and the USD set to widen, albeit slightly, further downside for the Fiber could be on the cards, especially if Friday’s NFP shows a still-healthy US labor market. If Friday’s NFP print, expected to show the US added 190K net new jobs in May, higher than the previous month’s 175K.
EUR/USD technical outlook
EUR/USD fell back from 1.0900 on Tuesday, slipping back into near-term congestion after a fresh break into the pair’s highest bids since March. The Fiber has ground sideways in a large consolidation range for most of the year, and the pair remains down from 2024’s opening bids near 1.1037.
The Fiber’s long-term technical floor is priced in at the 200-day Exponential Moving Average (EMA) at 1.0797. Despite Tuesday’s declines, the pair remains up 2.65% from the year’s botto mbids set in mid-April near 1.0600.
EUR/USD daily chart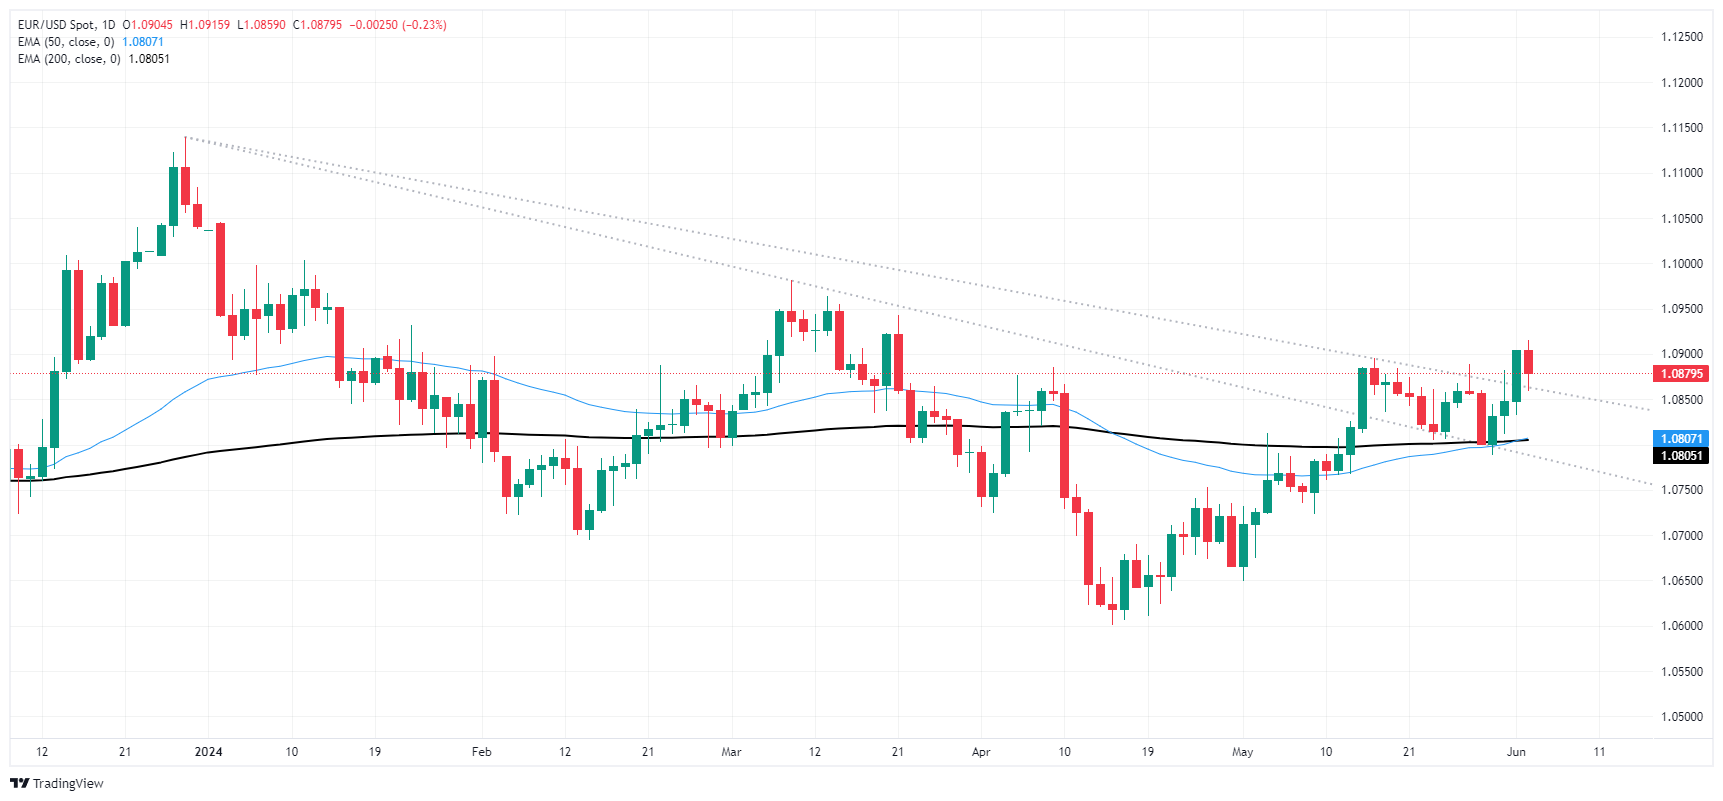
Author

Joshua Gibson
FXStreet
Joshua joins the FXStreet team as an Economics and Finance double major from Vancouver Island University with twelve years' experience as an independent trader focusing on technical analysis.


