|

EUR/USD Price Prediction: Chart of bad omens with break below trendline, Double Top

  • EUR/USD has broken below a key trendline and might have formed a bearish pattern. 
  • A Double Top reversal pattern could potentially be a bad omen for the pair. 
     

EUR/USD breaks below the trendline for the rally since June. On Tuesday it executes a throwback move to “air kiss the trendline goodbye” and now seems to be declining again.

The overall tenor of the chart suggests a bearish short-term outlook. Momentum as measured by the Moving Average Convergence Divergence (MACD) is in negative territory. If prices can close below Friday’s low at 1.0951 the break will be confirmed and a deeper decline is likely to unfold. 

EUR/USD Daily Chart 


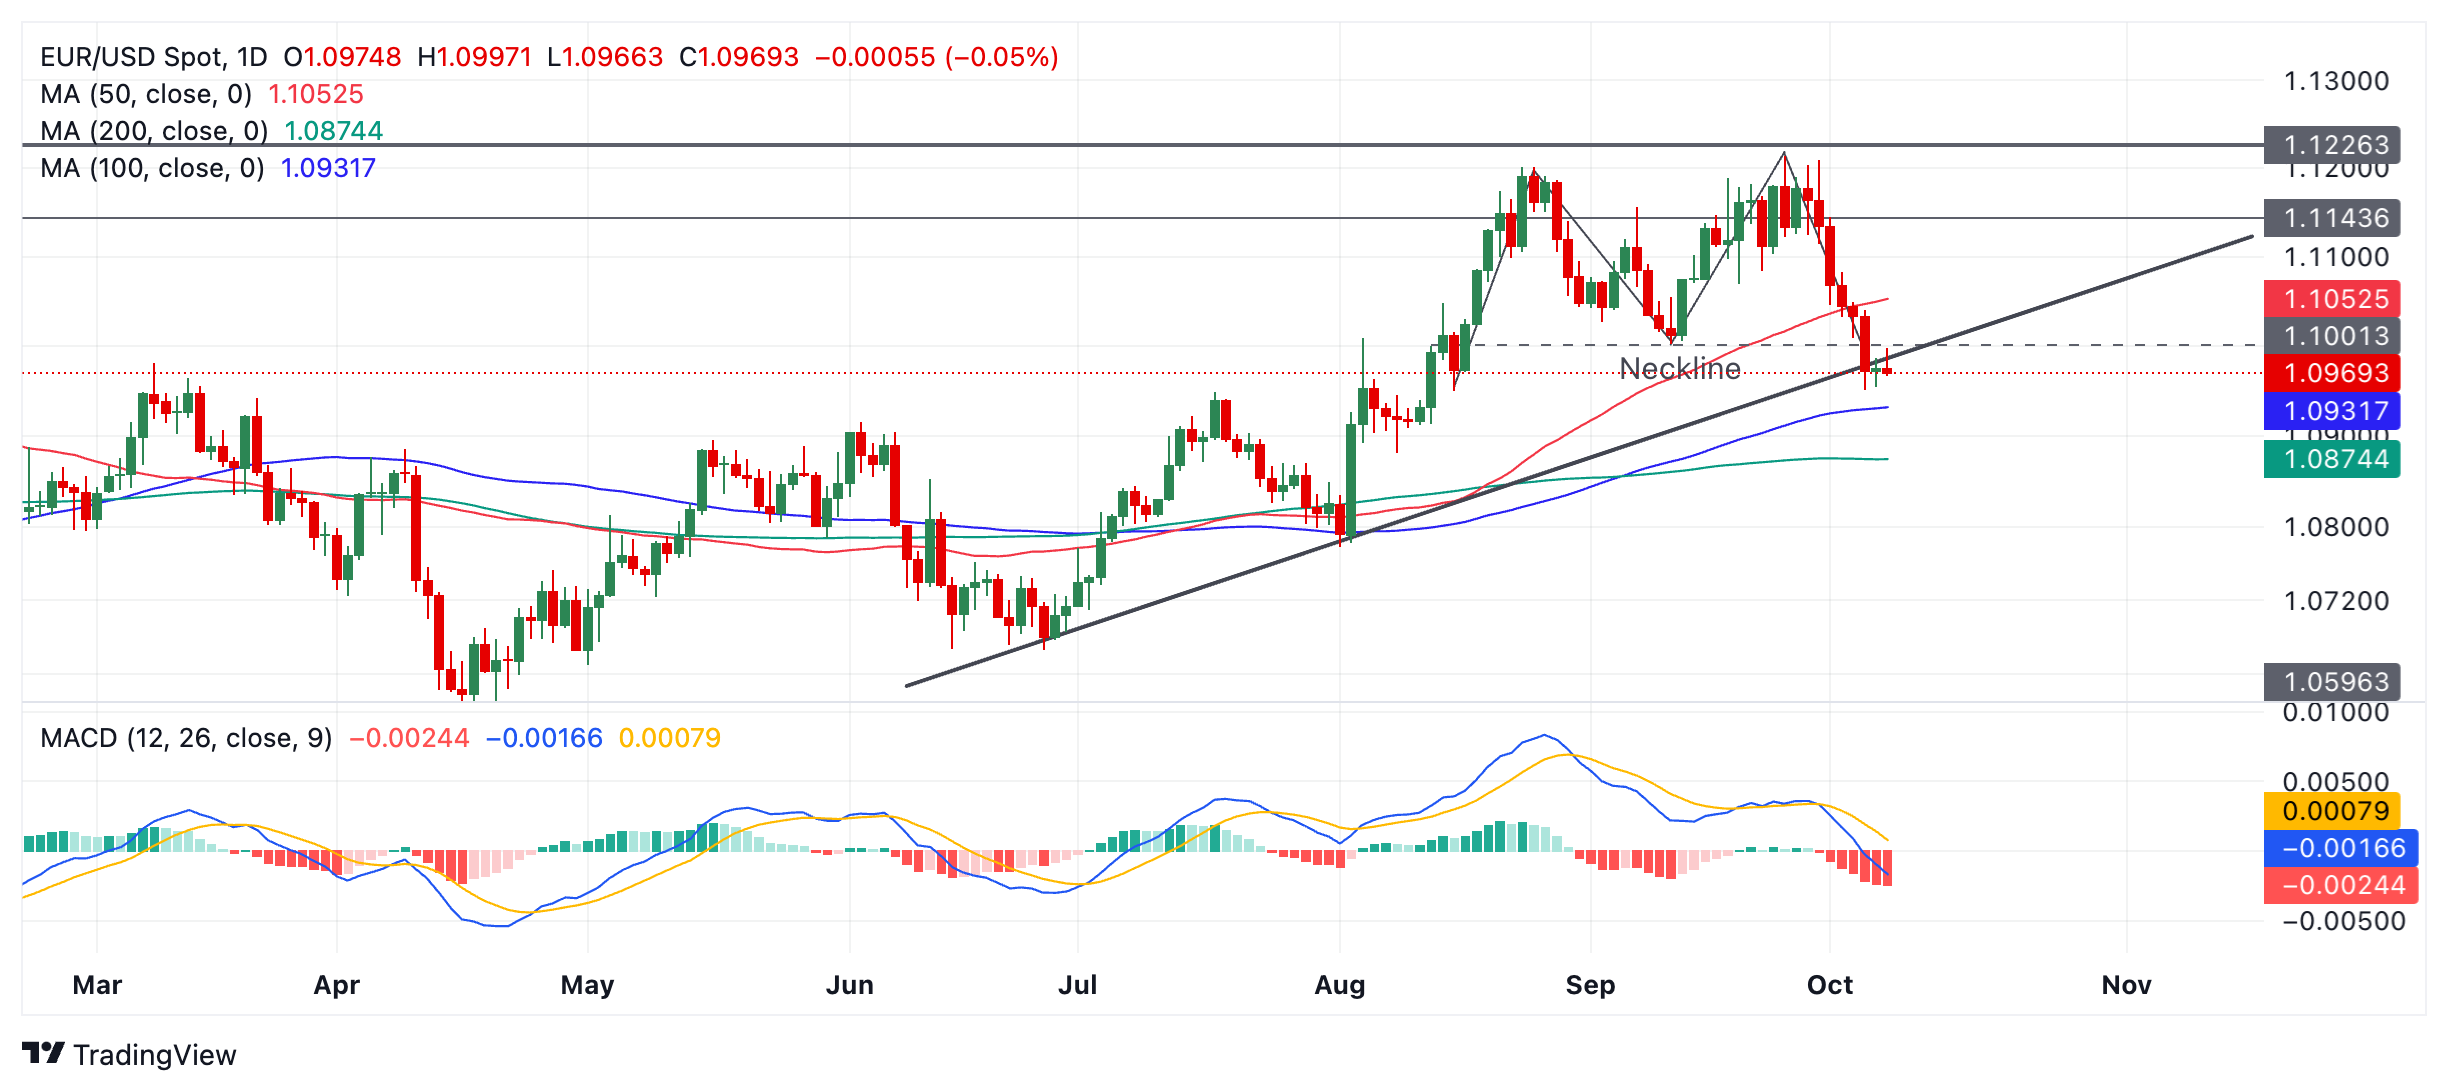
A confirmed break of the trendline would likely lead to a deeper sell-off. Such a move might reach a target at 1.0865 initially (the 61.8% Fibonacci (Fib) extrapolation of the move prior to the trendline break). The 200-day Simple Moving Average (SMA), however, could come in with support a little before then at 1.0875, suggesting another more conservative option. 

Adding to the bearish picture is the possible Double Top price pattern which might have formed during September. This is the “M” shaped pattern formed  just under the heavy resistance line at 1.1226. Double Tops are signals that the uptrend has reached its conclusion and price is reversing. The pattern's "neckline" at 1.1001 has already been broken, confirming activation of the pattern’s downside target at 1.0858, the 61.8% Fib extrapolation of the height of the pattern lower. 

Author

Joaquin Monfort

Joaquin Monfort is a financial writer and analyst with over 10 years experience writing about financial markets and alt data. He holds a degree in Anthropology from London University and a Diploma in Technical analysis.

More from Joaquin Monfort
Share:

Editor's Picks

EUR/USD climbs to daily highs near 1.1820

EUR/USD now picks up pace and advances to the area of daily peaks north of the 1.1800 barrier at the end of the week. The pair’s decent move higher comes against the backdrop of a generalised lack of direction in the FX galaxy and the mild offered stance in the US Dollar.

GBP/USD trims losses, retests 1.3460

After briefly challenging its key 200-day SMA near 1.3440, GBP/USD now manages to regain some balance and revisit the 1.3460 zone on Friday. Cable’s pullback comes as the selling pressure on the Greenback gathers traction, reigniting some recovery in the risk-linked space.

Gold flirts with four-week highs past $5,200

Gold extends its rebound, climbing for a third consecutive session and pushing back above the $5,200 mark per troy ounce on Friday. The move higher continues to draw support from lingering geopolitical tensions and the ongoing uncertainty surrounding US trade policy, both of which are keeping safe-haven demand firmly in play.

Bitcoin, Ethereum and Ripple consolidate with short-term cautious bullish bias

Bitcoin, Ethereum and Ripple are consolidating near key technical areas on Friday, showing mild signs of stabilization after recent volatility. BTC holds above $67,000 despite mild losses so far this week, while ETH hovers around $2,000 after a rejection near its upper consolidation boundary. 

Breaking: US and Israel attack Iran, risk aversion to sweep global markets

Early Saturday, United States (US) President Donald Trump announced that the US had begun “major combat operations” in Iran, following Israel’s pre-emptive missile attacks against Tehran.

Starknet unveils strkBTC, shielded Bitcoin transactions on Ethereum Layer 2

Starknet, the Ethereum Layer 2 network developed by StarkWare, today announced strkBTC, a wrapped Bitcoin asset that introduces optional shielding while preserving full DeFi composability.