EUR/USD Price Forecast: Tests 1.1800 barrier above 50-day EMA
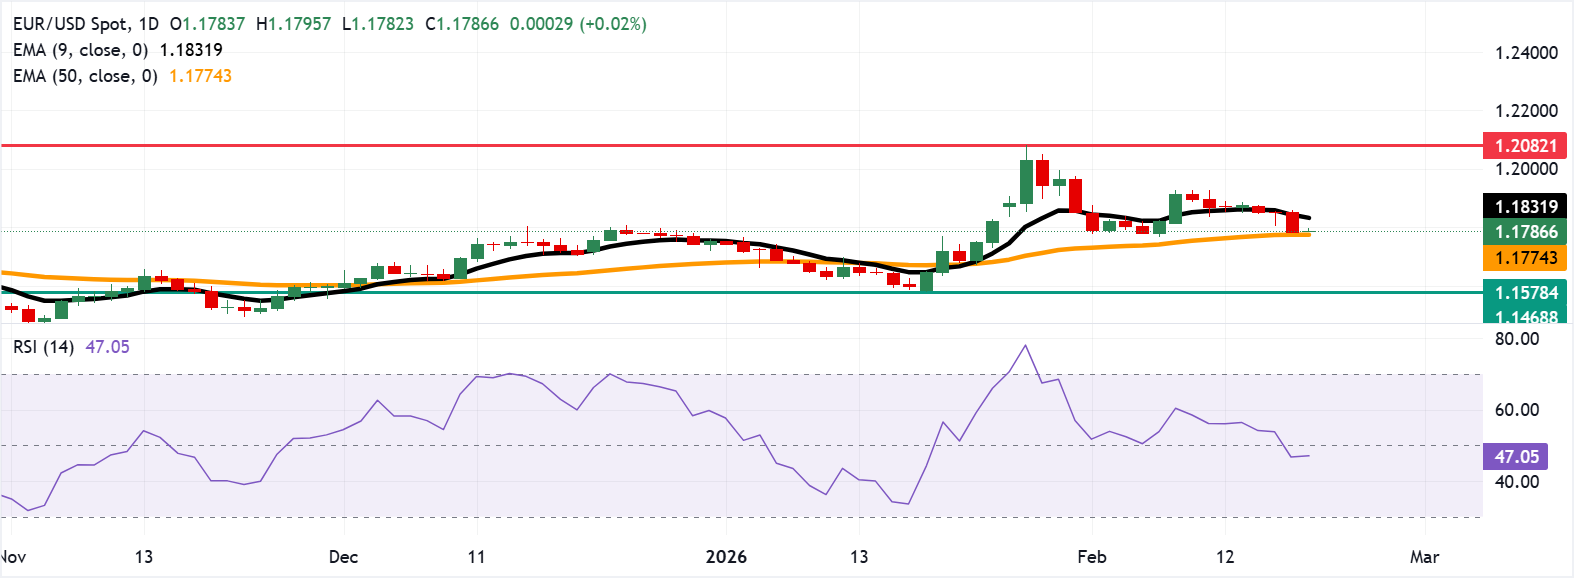
- EUR/USD tests the initial support at the 50-day EMA at 1.1774.
- The 14-day Relative Strength Index below 50 suggests limited upside follow-through.
- The psychological level of 1.1800 is acting as an immediate resistance.

EUR/USD gains ground after three days of losses, trading around 1.1790 during the Asian hours on Thursday. The 14-day Relative Strength Index (RSI) momentum indicator at 47 (neutral) reflects easing momentum. The RSI below 50 keeps momentum balanced and could limit follow-through.
The technical analysis of the daily chart shows that the 50-day Exponential Moving Average (EMA) rises, with price holding marginally above it. The nine-day EMA has flattened after earlier strength, keeping a short-term cap on recovery. With the short-term average still above the 50-day EMA, the bullish bias persists, though the narrowing spread warns of consolidation.
The initial support lies at the 50-day EMA at 1.1774. A drop back under the medium-term average would strengthen the bearish bias and expose the two-month low at 1.1578, recorded on January 19.
The EUR/USD pair tests the immediate barrier at the psychological level of 1.1800, followed by the nine-day EMA at 1.1833. A daily close above the short-term average would cause the emergence of the bullish bias and open the path toward 1.2082, the highest level since June 2021.
(The technical analysis of this story was written with the help of an AI tool.)
Euro Price Today
The table below shows the percentage change of Euro (EUR) against listed major currencies today. Euro was the weakest against the Australian Dollar.
| USD | EUR | GBP | JPY | CAD | AUD | NZD | CHF | |
|---|---|---|---|---|---|---|---|---|
| USD | -0.02% | 0.09% | 0.25% | 0.03% | -0.24% | -0.10% | 0.01% | |
| EUR | 0.02% | 0.12% | 0.24% | 0.03% | -0.22% | -0.08% | 0.04% | |
| GBP | -0.09% | -0.12% | 0.13% | -0.07% | -0.34% | -0.20% | -0.08% | |
| JPY | -0.25% | -0.24% | -0.13% | -0.24% | -0.49% | -0.39% | -0.25% | |
| CAD | -0.03% | -0.03% | 0.07% | 0.24% | -0.26% | -0.13% | -0.01% | |
| AUD | 0.24% | 0.22% | 0.34% | 0.49% | 0.26% | 0.14% | 0.26% | |
| NZD | 0.10% | 0.08% | 0.20% | 0.39% | 0.13% | -0.14% | 0.11% | |
| CHF | -0.01% | -0.04% | 0.08% | 0.25% | 0.01% | -0.26% | -0.11% |
The heat map shows percentage changes of major currencies against each other. The base currency is picked from the left column, while the quote currency is picked from the top row. For example, if you pick the Euro from the left column and move along the horizontal line to the US Dollar, the percentage change displayed in the box will represent EUR (base)/USD (quote).
Author

Akhtar Faruqui
FXStreet
Akhtar Faruqui is a Forex Analyst based in New Delhi, India. With a keen eye for market trends and a passion for dissecting complex financial dynamics, he is dedicated to delivering accurate and insightful Forex news and analysis.