EUR/USD Price Forecast: Symmetrical triangle break in focus as Fed decision looms
- EUR/USD consolidates near 1.1360 within a triangle, close to breakout levels.
- Eurozone and the United States data diverge as traders await the Fed policy tone.
- The Euro remains technically bullish against the US Dollar, but there are signs of bullish momentum fading.

EUR/USD is nearing a technical inflection point, where macroeconomic divergence and chart compression converge. While strong data from Germany and France support the Euro (EUR), weak retail sales and Federal Reserve (Fed) uncertainty have dampened momentum. Technically, the pair remains in an uptrend across higher time frames, but short-term direction hinges on a breakout from the current symmetrical triangle.
At the time of writing, EUR/USD is trading near 1.1364, down 0.05% intraday, with price action contained around the 20-day Simple Moving Average (SMA) and narrowing within the triangle formation on the 4-hour chart.
Europe, United States data diverge ahead of the Fed
Recent European data presents a mixed macro picture. On the positive side, German Factory Orders rose sharply by 3.6% month-over-month in March, well above the 1.3% forecast. France also posted a positive current account balance, helping to anchor Euro sentiment. However, this strength was offset by disappointing retail sales figures from Italy and the broader Eurozone, reflecting weak consumer demand amid growing concerns about trade tariffs and slower growth.
Across the Atlantic, the spotlight is on the Fed interest rate decision on Wednesday. While no immediate policy change is expected, markets are highly attuned to the tone of Fed Chair Jerome Powell’s press conference. Should Powell hint at rate cuts before July, the US Dollar could weaken, potentially triggering upside in EUR/USD. Conversely, a more data-dependent or hawkish tone could limit Euro strength and favor downside continuation.
EUR/USD nears inflection point as triangle tightens
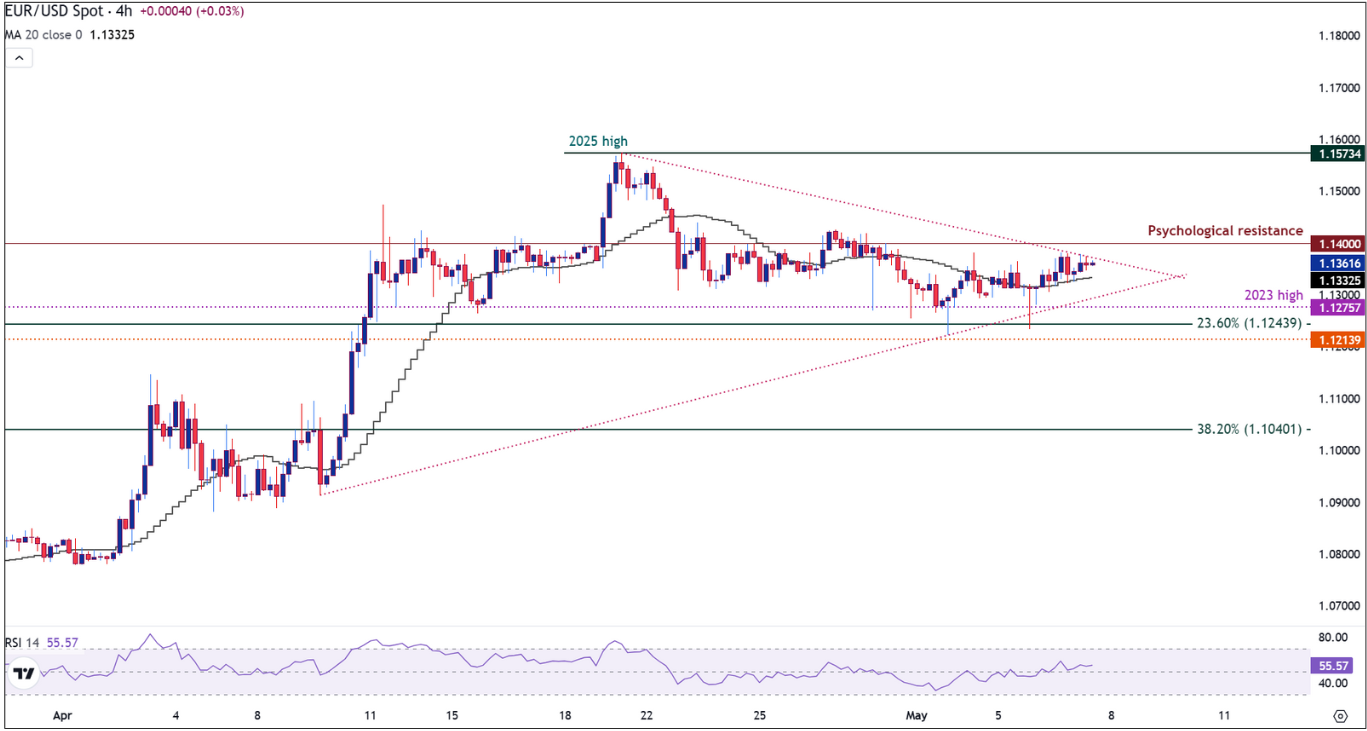
The 4-hour chart reveals a symmetrical triangle pattern, suggesting a breakout may be imminent. Price is compressing between resistance near 1.1400 and support at 1.1240–1.1275. This structure reflects market indecision, with momentum poised to expand once a directional bias is confirmed.
The 20-period SMA is flat at 1.1332, reinforcing the sideways trend. Meanwhile, the Relative Strength Index (RSI 14) sits at 54.86, indicating neutral momentum.
A confirmed break above 1.1400 would target the April high at 1.1573, while a break below 1.1240 would expose the pair to the 38.2% Fibonacci retracement of the YTD move at 1.1213.
Further downside could extend toward the 50% retracement at 1.1131 or even the 61.8% at 1.1050, if bearish momentum accelerates.
EUR/USD 4-hour chart
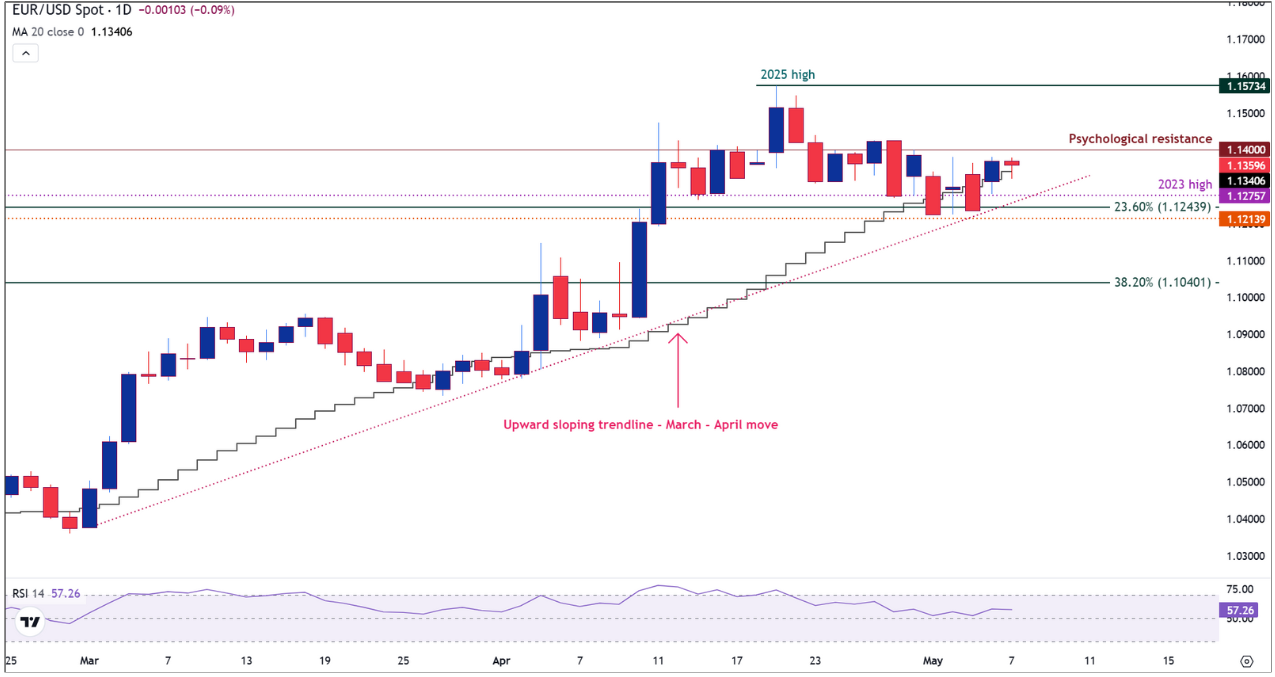
On the daily time frame, EUR/USD retains its bullish structure, supported by a rising trendline from the January low, and price trading well above the 200-day SMA, currently at 1.0782. However, recent sessions have seen repeated failures at 1.1400, confirming strong overhead resistance.
Support is layered around the 2023 high at 1.1276, followed by the 23.6% Fibonacci retracement at 1.1286, and the trendline just below. The RSI reads 57.33, still in bullish territory, though showing signs of softening momentum. As long as 1.1213-1.1240 holds, the medium-term uptrend remains intact. A sustained drop below this area would turn attention to the 1.1131-1.1050 support zone.
EUR/USD daily chart
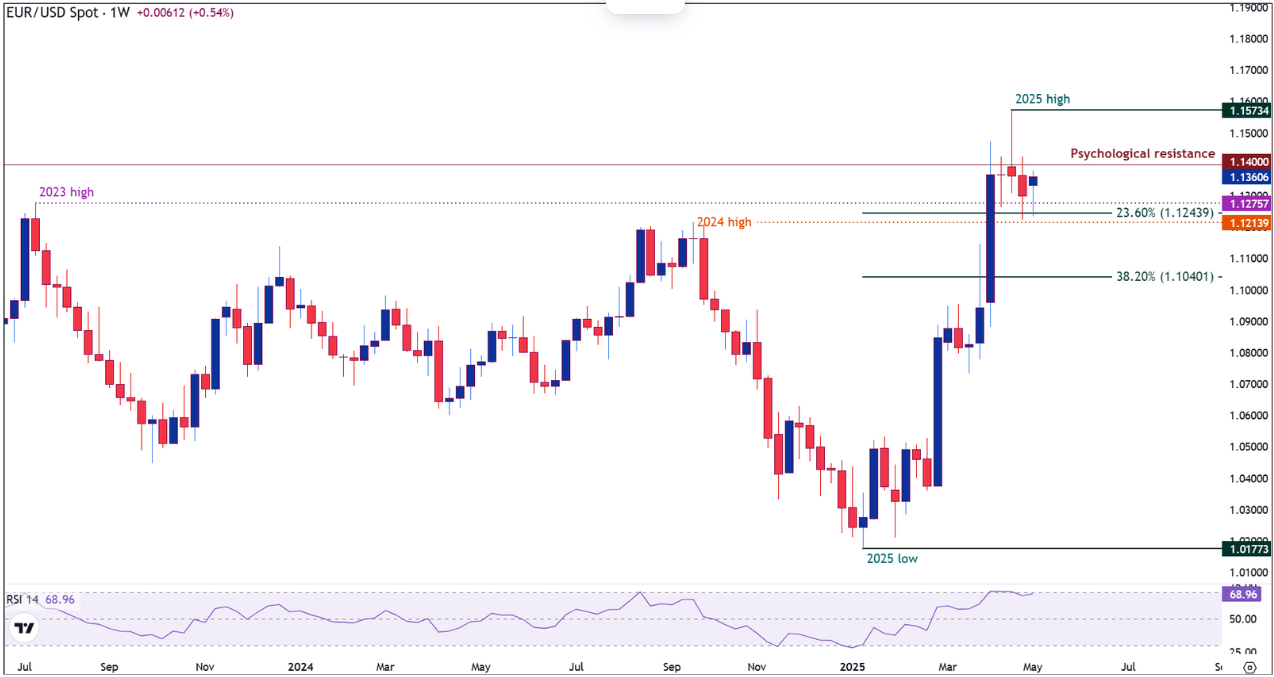
EUR/USD longer-term outlook: Bullish reversal pauses below 1.1570
The weekly chart confirms a double bottom reversal from late 2024 into early 2025, with a strong breakout above 1.0800 that launched a multi-week rally. However, the advance has paused below key resistance at 1.1573, the 2025 high, and a historically reactive zone.
Candlestick structure has shifted toward indecision, with small-bodied candles and upper wicks indicating potential buyer exhaustion. The weekly RSI is hovering at 69.12, just shy of overbought territory, signaling that a brief pullback or sideways consolidation may be needed before any attempt to break higher.
Should price correct, key supports lie at the 23.6% retracement at 1.1286, followed by 1.1213 (38.2%) and 1.1131 (50%), marking areas where buyers may re-engage.
EUR/USD is currently trapped between technical compression on short-term charts and a stalling rally on higher time frames. While the broader trend remains constructive, directional clarity depends on a breakout from the 1.1400-1.1240 range.
A move above 1.1400 would confirm bullish continuation toward 1.1573, while a break below 1.1240, especially under 1.1213, would indicate a deeper correction. As traders await guidance from Fed Chair Powell, volatility is expected to rise, making this triangle setup one to watch closely.
Author

Tammy Da Costa, CFTe®
FXStreet
Tammy is an economist and market analyst with a deep passion for financial markets, particularly commodities and geopolitics.