EUR/USD Price Forecast: Holds losses below 1.1900 despite bullish bias
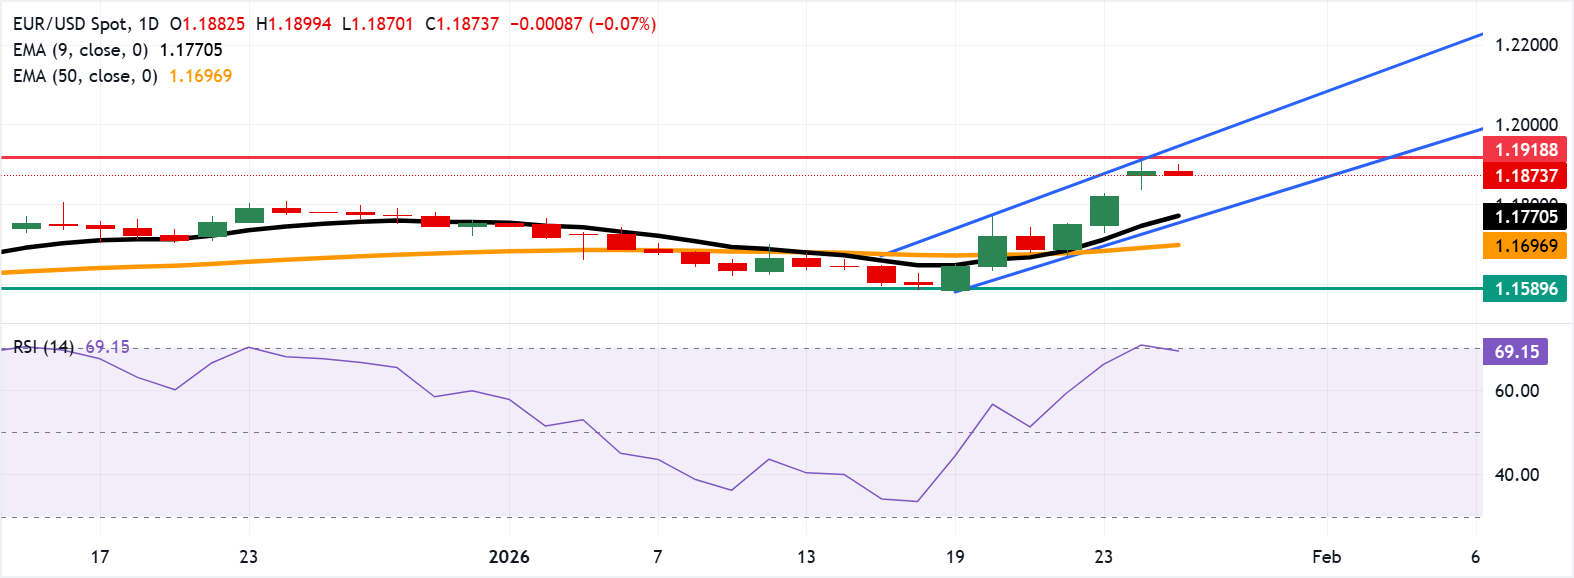
- EUR/USD could rebound toward the 1.1918, the highest level since June 2021.
- The 14-day Relative Strength Index is near 69, confirming strong bullish momentum.
- The initial support lies at the nine-day EMA of 1.1770.

EUR/USD edges lower after three days of gains, trading around 1.1870 during the Asian hours on Tuesday. The technical analysis of the daily chart shows that the pair rises within the ascending channel pattern, suggesting an ongoing bullish bias.
The nine-day Exponential Moving Average (EMA) stands above the 50-day EMA, and both rise, keeping the short-term bias upward. Pullbacks would find dynamic support at these averages.
The 14-day Relative Strength Index (RSI) momentum indicator at 68.90 sits just below overbought, confirming firm bullish momentum after a recent upswing.
Immediate resistance aligns at 1.1918, the highest level since June 2021, followed by the upper boundary of the ascending channel around 1.1950. Further advances above the channel would support the EUR/USD pair to target the psychological level of 1.2000.
On the downside, the EUR/USD pair may navigate the region around the confluence of the nine-day EMA at 1.1770 and the lower boundary of the ascending channel around 1.1750. A break below the channel would put downward pressure on the pair to test the 50-day EMA at 1.1697, followed by the seven-week low at 1.1589, set on December 1, followed by the lower boundary of the descending channel around 1.1570.
(The technical analysis of this story was written with the help of an AI tool.)
Euro Price Today
The table below shows the percentage change of Euro (EUR) against listed major currencies today. Euro was the weakest against the US Dollar.
| USD | EUR | GBP | JPY | CAD | AUD | NZD | CHF | |
|---|---|---|---|---|---|---|---|---|
| USD | 0.08% | 0.05% | 0.32% | 0.15% | 0.09% | 0.20% | 0.15% | |
| EUR | -0.08% | -0.03% | 0.28% | 0.07% | 0.01% | 0.12% | 0.07% | |
| GBP | -0.05% | 0.03% | 0.30% | 0.09% | 0.04% | 0.15% | 0.10% | |
| JPY | -0.32% | -0.28% | -0.30% | -0.21% | -0.27% | -0.17% | -0.20% | |
| CAD | -0.15% | -0.07% | -0.09% | 0.21% | -0.05% | 0.05% | 0.00% | |
| AUD | -0.09% | -0.01% | -0.04% | 0.27% | 0.05% | 0.10% | 0.06% | |
| NZD | -0.20% | -0.12% | -0.15% | 0.17% | -0.05% | -0.10% | -0.04% | |
| CHF | -0.15% | -0.07% | -0.10% | 0.20% | -0.01% | -0.06% | 0.04% |
The heat map shows percentage changes of major currencies against each other. The base currency is picked from the left column, while the quote currency is picked from the top row. For example, if you pick the Euro from the left column and move along the horizontal line to the US Dollar, the percentage change displayed in the box will represent EUR (base)/USD (quote).
Author

Akhtar Faruqui
FXStreet
Akhtar Faruqui is a Forex Analyst based in New Delhi, India. With a keen eye for market trends and a passion for dissecting complex financial dynamics, he is dedicated to delivering accurate and insightful Forex news and analysis.


