|

EUR/USD Price Analysis: Trims some weekly losses, meanders at 1.1250 as traders head into the weekend

  • The euro edges down 0.58% so far in the week, after falling in three of the week’s five trading days.
  • The EUR/USD reached a 2022 YTD low at 1.1106 on Thursday.
  • EUR/USD Technical Outlook: The pair is downward biased.

On Friday, the EUR/USD trims some of its weekly losses, recording gains of 0.48% during the North American session. At press time, the EUR/USD is trading at 1.1252.

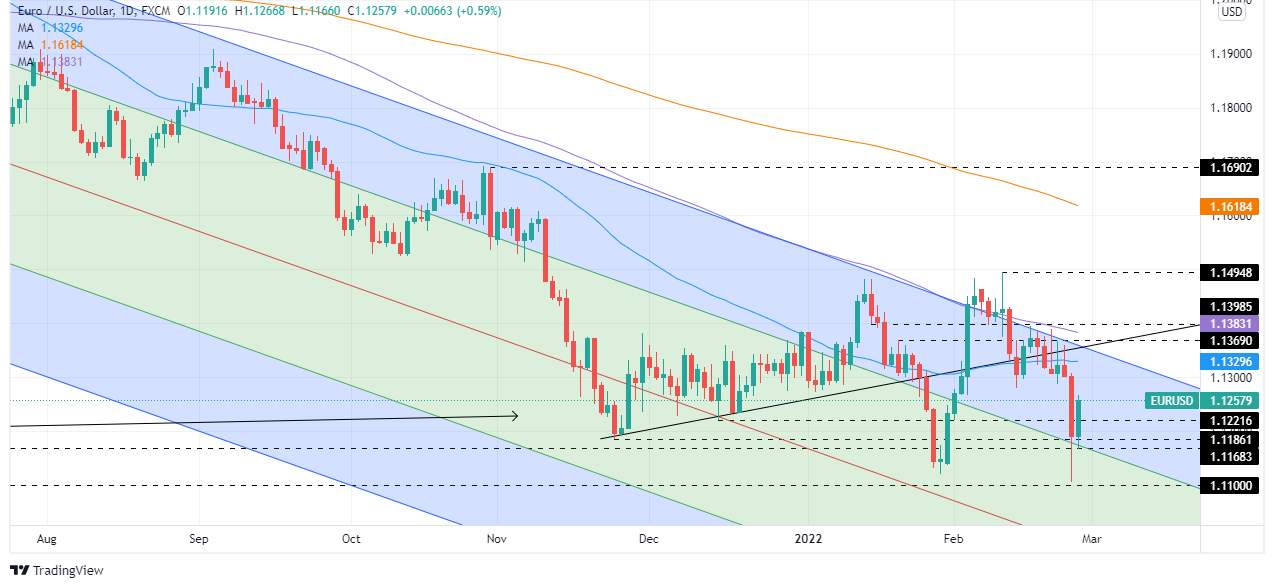
In the overnight session for North American traders, the shared currency seesawed in the 1.1168.1,1230 range, most of the time. Nevertheless, before Wall Street’s opened, the EUR/USD rallied above 1.1200, breaking on its way, the 100-hour simple moving average (SMA) at 1.1223, reaching a daily high at 1.1266 to stabilize around the 1.1240 area.

EUR/USD Price Forecast: Technical outlook

On Thursday, the EUR/USD reached a YTD low at 1.1106, near the 1.1100 mark, though closed above the mid-line between the top/central Pitchfork’s parallel lines, suggesting profit-taking and buying pressure lifted the pair at the end of New York’s session. It is worth noting that EUR/USD daily moving averages (DMAs) reside above the actual exchange rate, indicating a downward bias. That said, the EUR/USD could aim higher, near February 24 daily high at 1.1308, followed by a leg-down towards the 1.1000 area.

In that outcome, the EUR/USD first support would be 1.1200. Breach of the latter would expose Pitchfork-s mid-line within the top/central parallel lines around 1.1165, followed by February 24 daily low at 1.1106.
EUR/USD

Overview
Today last price1.1252
Today Daily Change0.0052
Today Daily Change %0.46
Today daily open1.12
 
Trends
Daily SMA201.1338
Daily SMA501.133
Daily SMA1001.1387
Daily SMA2001.1625
 
Levels
Previous Daily High1.1312
Previous Daily Low1.1106
Previous Weekly High1.1396
Previous Weekly Low1.128
Previous Monthly High1.1483
Previous Monthly Low1.1121
Daily Fibonacci 38.2%1.1185
Daily Fibonacci 61.8%1.1233
Daily Pivot Point S11.11
Daily Pivot Point S21.1001
Daily Pivot Point S31.0895
Daily Pivot Point R11.1305
Daily Pivot Point R21.1411
Daily Pivot Point R31.1511

Author

Christian Borjon Valencia

Markets analyst, news editor, and trading instructor with over 14 years of experience across FX, commodities, US equity indices, and global macro markets.


More from Christian Borjon Valencia
Share:

Editor's Picks

AUD/USD stays vulnerable below 0.6800 after weak China data

AUD/USD kicks off the week subdued, consolidating recent heavy losses to its lowest level since January. The pair stays defensive below 0.6800 after China’s October Retail Sales and Industrial Production disappointed, keeping the Chinese proxy, the Australian Dollar, undermined amid a broadly bullish US Dollar and fresh US-Iran tensions.

USD/JPY trades better bid above 159.50 after dismal Japan Q3 GDP

USD/JPY stays better bid above 159.50 at the start of the new week on Monday, reacting little to dismal data showing that Japan’s economy unexpectedly shrank by 0.1% in Q3. Furthermore, a wide US-Japan rate differential undermines the Japanese Yen, though intervention risks limit losses. Meanwhile, the US Dollar sits near a 19-month high amid certainty of a Fed rate hike and geopolitical risks, supporting the pair.


Gold hangs near 13-month lows below $3,900 as Fed hike bets support USD

Gold remains within striking distance of the October 2025 lows touched last week. Firming Fed rate-hike expectations help the US Dollar preserve its recent gains to a 19-month top. Moreover, geopolitical uncertainties further underpin the safe-haven buck, which favors XAU/USD bears and suggests that any meaningful recovery attempt is likely to be sold into.

Bitcoin just lost $70,000 and the oversold signal isn't stopping sellers
Bitcoin is under $70K for the first time since August, a month after a popular momentum gauge first called the selling overdone. Sellers include fund investors pulling money out, and traders forced out of borrowed bets, with another US rate increase expected in December.
US Dollar Weekly Forecast: The Fed's inflation nightmare is the Dollar's best friend

The US Dollar’s rally appears anything but abated so far. Indeed, the Greenback advanced to levels last visited in April 2025, well past the 103.00 barrier when gauged by the US Dollar Index.

Gold hit its lowest level of 2026 near $3,850
Gold (XAU/USD) attempts to stabilize around $3,890 on Friday after falling to $3,852 on Thursday, its lowest level since October 2025. The precious metal has lost more than 4% this week, as investors increasingly anticipate further monetary tightening from the Federal Reserve (Fed). The latest decline reflects a sharp change in market expectations.