EUR/USD Price Analysis: The crucial resistance level will emerge at the 1.0790–1.0800 region


  • EUR/USD weakens to 1.0775 on the firmer USD on Friday.
  • The pair keeps the bearish vibe below the key EMA on the daily timeframe. 
  • The key resistance level will emerge in the 1.0790–1.0800 zone; the first downside target is located at 1.0724.

The EUR/USD pair trades on a softer note near 1.0775 during the early European hours on Friday. The downtick of the major pair is supported by the renewed US Dollar (USD) demand amid hawkish comments from Federal Reserve (Fed) officials. Later on Friday, the US Michigan Consumer Sentiment Index for May will be released, which is projected to drop from 77.2 in April to 76.0 in May. 

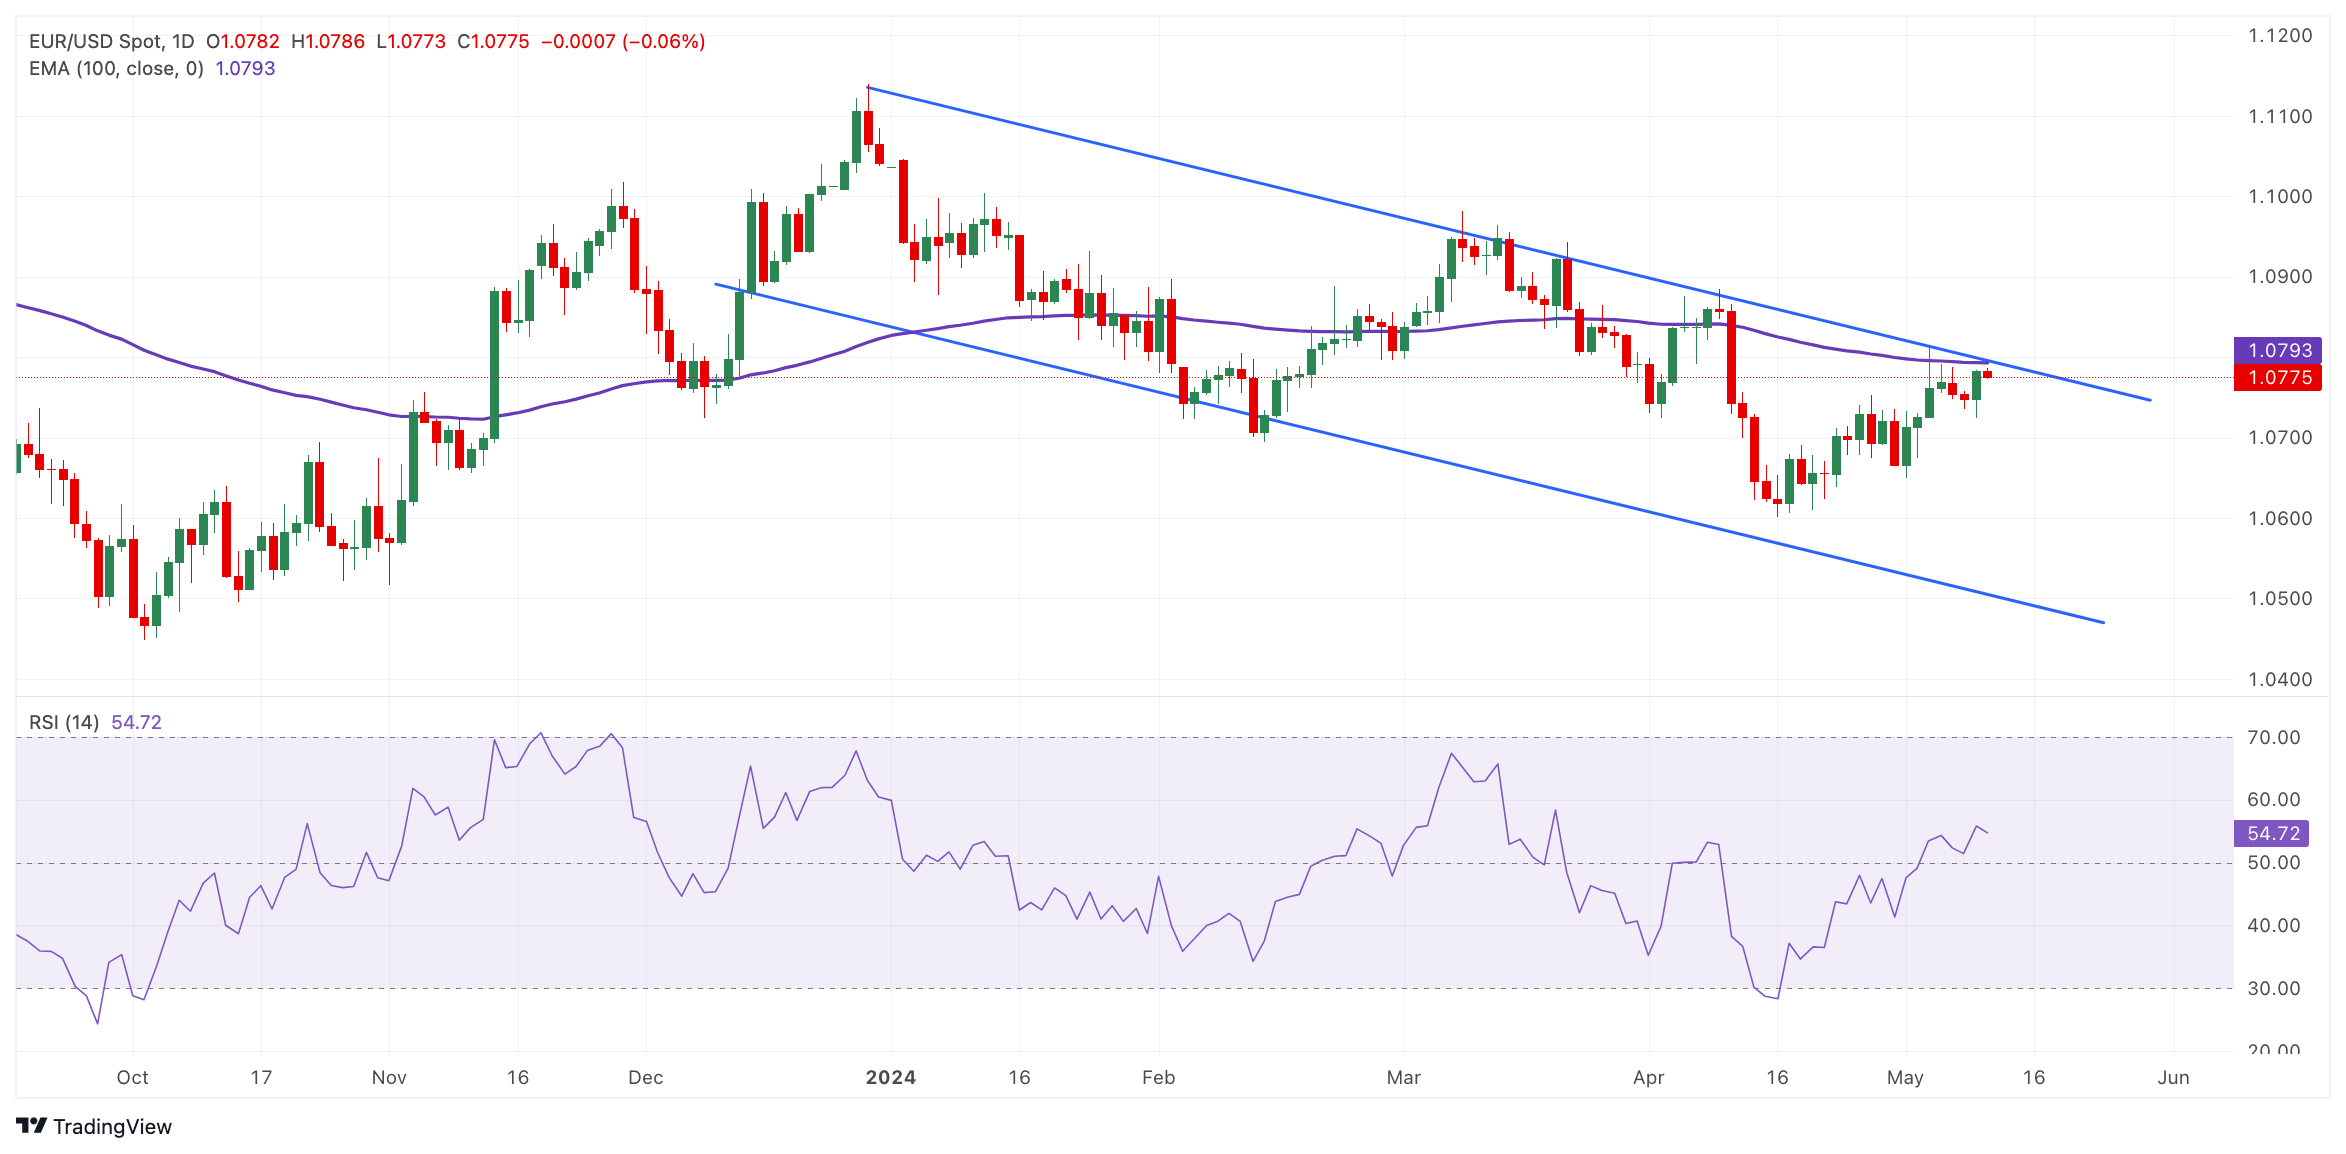
According to the daily chart, EUR/USD has traded within a descending trend channel since mid-December 2023. The bearish outlook of the major pair remains intact, as it is below the key 100-period Exponential Moving Average (EMA). However, the 14-day Relative Strength Index (RSI) stands in bullish territory around 55, indicating that further upside cannot be ruled out. 

The key resistance level for EUR/USD will emerge at the 1.0790–1.0800 region, portraying the 100-day EMA and the upper boundary of the descending trend channel. The next upside barrier is seen near a high of April 9 at 1.0885. The additional upside filter to watch is a high of March 21 at 1.0943, followed by March 8 at 1.0981, and finally the 1.1000 psychological level.  

On the downside, the first downside target is located near a low of May 9 at 1.0724. Extended losses for EUR/USD expose the pair to a low of May 2 at 1.0650, en route to a low of April 16 at 1.0600. A break below this level will see a drop to the lower limit of the descending trend channel at 1.0500.  

EUR/USD daily chart

EUR/USD

Overview
Today last price 1.0774
Today Daily Change -0.0008
Today Daily Change % -0.07
Today daily open 1.0782
 
Trends
Daily SMA20 1.0699
Daily SMA50 1.079
Daily SMA100 1.0833
Daily SMA200 1.0794
 
Levels
Previous Daily High 1.0784
Previous Daily Low 1.0724
Previous Weekly High 1.0812
Previous Weekly Low 1.065
Previous Monthly High 1.0885
Previous Monthly Low 1.0601
Daily Fibonacci 38.2% 1.0761
Daily Fibonacci 61.8% 1.0747
Daily Pivot Point S1 1.0742
Daily Pivot Point S2 1.0703
Daily Pivot Point S3 1.0682
Daily Pivot Point R1 1.0803
Daily Pivot Point R2 1.0824
Daily Pivot Point R3 1.0864


Share: Feed news

Information on these pages contains forward-looking statements that involve risks and uncertainties. Markets and instruments profiled on this page are for informational purposes only and should not in any way come across as a recommendation to buy or sell in these assets. You should do your own thorough research before making any investment decisions. FXStreet does not in any way guarantee that this information is free from mistakes, errors, or material misstatements. It also does not guarantee that this information is of a timely nature. Investing in Open Markets involves a great deal of risk, including the loss of all or a portion of your investment, as well as emotional distress. All risks, losses and costs associated with investing, including total loss of principal, are your responsibility. The views and opinions expressed in this article are those of the authors and do not necessarily reflect the official policy or position of FXStreet nor its advertisers. The author will not be held responsible for information that is found at the end of links posted on this page.

If not otherwise explicitly mentioned in the body of the article, at the time of writing, the author has no position in any stock mentioned in this article and no business relationship with any company mentioned. The author has not received compensation for writing this article, other than from FXStreet.

FXStreet and the author do not provide personalized recommendations. The author makes no representations as to the accuracy, completeness, or suitability of this information. FXStreet and the author will not be liable for any errors, omissions or any losses, injuries or damages arising from this information and its display or use. Errors and omissions excepted.

The author and FXStreet are not registered investment advisors and nothing in this article is intended to be investment advice.

Recommended content


Recommended content

Editors’ Picks

AUD/USD gathers strength above 0.6400 amid optimism in US-China trade talks

AUD/USD gathers strength above 0.6400 amid optimism in US-China trade talks

AUD/USD edges higher to around 0.6420 during the early Asian session on Monday. Optimism in US-China trade negotiations in Geneva, Switzerland, boosts the Australian Dollar against the Greenback. Traders will keep an eye on positive developments that could support the China-proxy Aussie.

USD/JPY rises to over one-month high on US-China trade deal optimism

USD/JPY rises to over one-month high on US-China trade deal optimism

USD/JPY touches over a one-month high at the start of a new week in reaction to a US-China trade deal. Meanwhile, trade optimism helps ease concerns about a recession in the US. Moreover, the Fed's hawkish pause provides a goodish lift to the USD and further supports the currency pair. 

Gold tumbles below $3,300 on progress in US-China trade talks

Gold tumbles below $3,300 on progress in US-China trade talks

Gold price attracts some sellers to near $3,275 during the early Asian session on Monday, pressured by a stronger US Dollar. Optimism in US-China trade talks in Geneva, Switzerland, over the weekend has dragged the precious metal lower. 

Week ahead: All eyes on US CPI and trade talks amid no end to tariff uncertainty

Week ahead: All eyes on US CPI and trade talks amid no end to tariff uncertainty

US CPI report takes centre stage to gauge tariff impact. Progress in trade negotiations will also be watched, especially with China. US Retail Sales, UK and Japanese GDP on the agenda too.

Why the UK-US trade deal won’t herald a wider tariff climbdown

Why the UK-US trade deal won’t herald a wider tariff climbdown

For Britain, the UK-US deal secures lower tariffs without compromising forthcoming UK-EU talks. And for the US, it signals to investors that the administration is prepared to be flexible on tariffs. But we're sceptical that the deal will translate into a much wider de-escalation in US tariff policy.

The Best brokers to trade EUR/USD

The Best brokers to trade EUR/USD

SPONSORED Discover the top brokers for trading EUR/USD in 2025. Our list features brokers with competitive spreads, fast execution, and powerful platforms. Whether you're a beginner or an expert, find the right partner to navigate the dynamic Forex market.

Forex MAJORS

Cryptocurrencies

Signatures

Best Brokers of 2025