|

EUR/USD Price Analysis: Seems vulnerable below mid-1.0500s amid bullish USD

  • EUR/USD consolidates in a narrow trading band through the Asian session on Thursday.
  • The fundamental backdrop and the technical setup support prospects for further losses.
  • A convincing breakout through the descending channel hurdle will negate the bearish bias.

The EUR/USD pair struggles to gain any meaningful traction on Thursday and oscillates in a narrow band below mid-1.0500s through the Asian session. The fundamental backdrop, meanwhile, seems tilted in favour of bearish traders and suggests that the path of least resistance for spot prices is to the downside.

Growing acceptance that the Federal Reserve (Fed) will hold rates higher for longer in the wake of a resilient US economy and to bring inflation back to its 2% target push the benchmark 10-year Treasury yield to a fresh 16-year peak. This, along with the risk of an escalation in war between Hamas and Israel, continues to underpin the US Dollar (USD). Apart from this, speculations that further rate hikes by the European Central Bank (ECB) may be off the table validate the negative outlook for the EUR/USD pair.

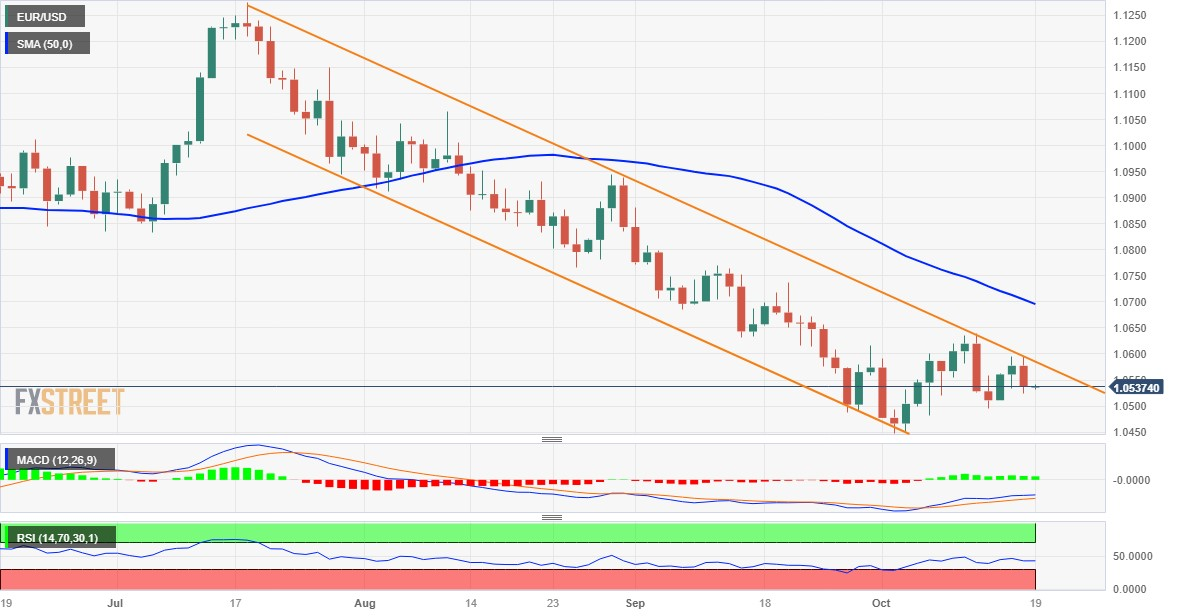
Even from a technical perspective, the recent failures near the top boundary of a downward-sloping channel extending from a 17-month peak touched in June point to a well-established short-term bearish trend. Moreover, oscillators on the daily chart, though have been recovering from lower levels, are still holding in the negative territory. This, in turn, supports prospects for an extension of this week's downfall from the vicinity of the 1.0600 mark and a further depreciating move for the EUR/USD pair.

Hence, a slide back towards retesting the weekly low, around the 1.0500 psychological mark, looks like a distinct possibility. Some follow-through selling will be seen as a fresh trigger for bearish traders and drag the EUR/USD pair back to the YTD trough, around the 1.0450-1.0445 region touched earlier this month.

On the flip side, the 1.0600 mark, which now coincides with the descending trend-channel resistance, should continue to act as an immediate strong barrier. A convincing breakout should allow the EUR/USD pair to surpass the monthly peak, around the 1.0635 region and aim to reclaim the the1.0700 mark, representing the 50-day Simple Moving Average (SMA). The latter should act as a key pivotal point, which if cleared decisively will suggest that spot prices have formed a near-term bottom and pave the way for additional gains. 

EUR/USD daily chart

fxsoriginal

Technical levels to watch

EUR/USD

Overview
Today last price1.0537
Today Daily Change0.0000
Today Daily Change %0.00
Today daily open1.0537
 
Trends
Daily SMA201.056
Daily SMA501.0705
Daily SMA1001.0829
Daily SMA2001.0822
 
Levels
Previous Daily High1.0594
Previous Daily Low1.0523
Previous Weekly High1.064
Previous Weekly Low1.0496
Previous Monthly High1.0882
Previous Monthly Low1.0488
Daily Fibonacci 38.2%1.055
Daily Fibonacci 61.8%1.0567
Daily Pivot Point S11.0509
Daily Pivot Point S21.048
Daily Pivot Point S31.0438
Daily Pivot Point R11.058
Daily Pivot Point R21.0622
Daily Pivot Point R31.065

Author

Haresh Menghani

Haresh Menghani is a detail-oriented professional with 10+ years of extensive experience in analysing the global financial markets.

More from Haresh Menghani
Share:

Markets move fast. We move first.

Orange Juice Newsletter brings you expert driven insights - not headlines. Every day on your inbox.

By subscribing you agree to our Terms and conditions.

Editor's Picks

EUR/USD trades around 1.1700 after rebounding from 50-day EMA

EUR/USD gains ground after three days of losses, trading around 1.1700 during the Asian hours on Wednesday. On the daily chart, technical analysis indicates a potential for a bearish bias; the 14-day Relative Strength Index at 47 confirms waning momentum.

GBP/USD consolidates around 1.3500; looks to US macro data for fresh impetus

The GBP/USD pair oscillates in a narrow range, around the 1.3500 psychological mark during the Asian session on Wednesday, and for now, seems to have stalled the previous day's retracement slide from its highest level since September 18. Moreover, the fundamental backdrop seems tilted in favor of bullish traders and suggests that the path of least resistance for spot prices is to the upside.

Gold sees profit-taking decline after facing rejection at $4,500

Gold price sees a decline on profit-taking after facing rejection at $4,500 in the Asian trading hours on Wednesday. Despite the pullback, the traditional safe haven remains underpinned by geopolitical tensions and expectations of Fed rate cuts. The US ADP Jobs data, JOLTS Job Openings Survey and ISM Services Purchasing Managers Index report will be published on Wednesday. 

Top Crypto Gainers: JasmyCoin rallies as Cosmos and Bittensor retreat

JasmyCoin, Cosmos, and Bittensor are among the top-performing cryptocurrency assets in the last 24 hours. JasmyCoin leads the rally with double-digit gains, and bulls are targeting further gains, while Cosmos and Bittensor struggle to extend their gains after six consecutive days of recovery. 

Implications of US intervention in Venezuela

Events in Venezuela are top of mind for market participants, and while developments are associated with an elevated degree of uncertainty, we are not making any changes to our markets or economic forecasts as a result of the deposition of Nicolás Maduro. 

Cardano holds steady as bulls intensify push for breakout

Cardano rises above the 50-day EMA resistance amid a risk-on mood across the crypto market. The MACD upholds positive divergence, increasing the potential for a 20% breakout to $0.505.