|

EUR/USD Price Analysis: Remains below 1.0750 after breaking below the rectangle formation

  • The EUR/USD pair could test a level of 1.0700 following the throwback support level of 1.0601.
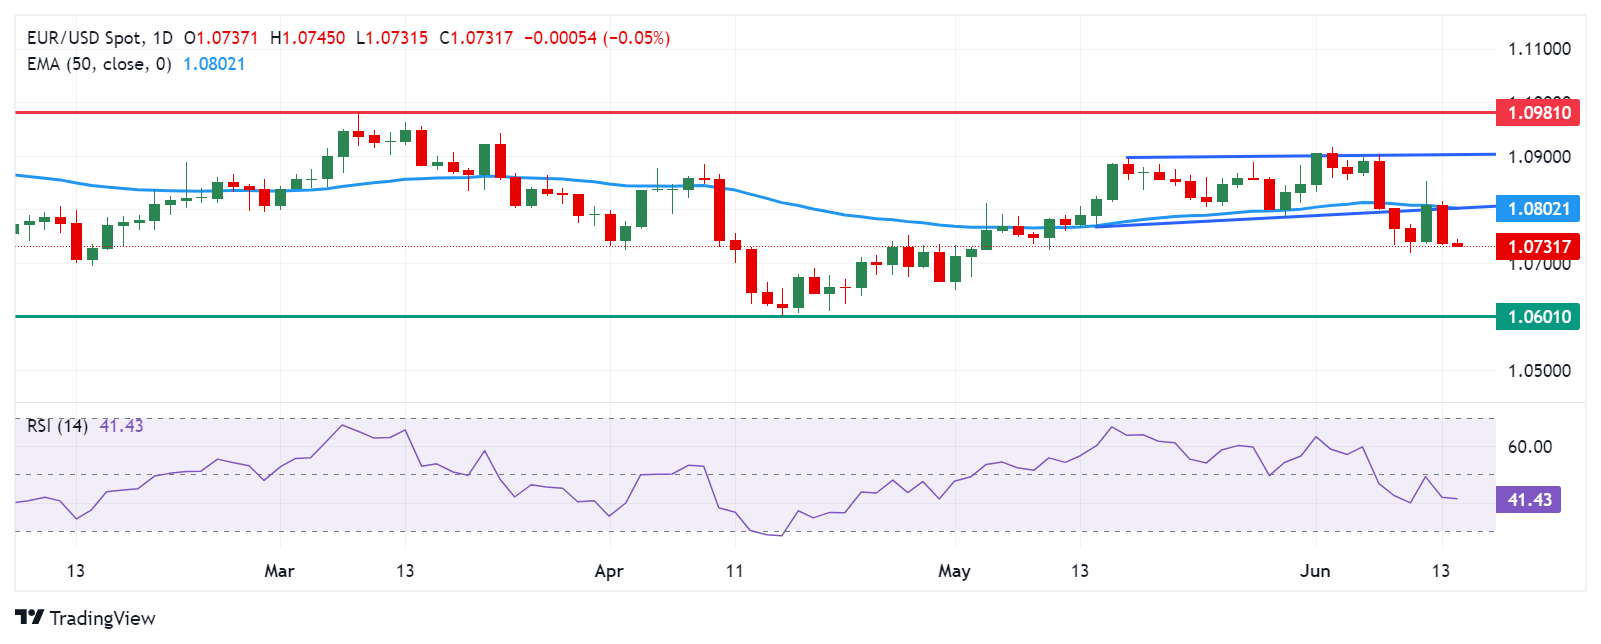
  • Technical analysis of the daily chart suggests a bearish bias for the pair.
  • The immediate barrier appears at the lower boundary of the rectangle formation around the 50-day EMA at 1.0802.

EUR/USD extends its losses for the second consecutive day, trading around 1.0730 during the Asian session on Friday. A technical analysis of a daily chart suggests a bearish bias for the pair, as it struggles below the lower threshold of a rectangle formation.

Additionally, the momentum indicator 14-day Relative Strength Index (RSI) is positioned below the 50 level, suggesting a confirmation of a bearish bias for the EUR/USD pair.

The EUR/USD pair could find immediate support at the psychological level of 1.0700. A break below this level could exert downward pressure on the pair to test the throwback support level of 1.0601.

On the upside, the EUR/USD pair could re-test the lower boundary of the rectangle formation around the 50-day Exponential Moving Average (EMA) at 1.0802. A return to the rectangle formation could weaken the bearish bias and reinforce the pair to explore the psychological level of 1.0900, aligned with the upper boundary of the rectangle formation around the level of 1.0905.

A breakthrough above the latter could support the pair to explore the region around March’s high of 1.0981.

EUR/USD: Daily Chart

EUR/USD

Overview
Today last price1.0736
Today Daily Change-0.0001
Today Daily Change %-0.01
Today daily open1.0737
 
Trends
Daily SMA201.0833
Daily SMA501.0776
Daily SMA1001.0803
Daily SMA2001.0789
 
Levels
Previous Daily High1.0816
Previous Daily Low1.0733
Previous Weekly High1.0916
Previous Weekly Low1.08
Previous Monthly High1.0895
Previous Monthly Low1.065
Daily Fibonacci 38.2%1.0765
Daily Fibonacci 61.8%1.0785
Daily Pivot Point S11.0708
Daily Pivot Point S21.0679
Daily Pivot Point S31.0624
Daily Pivot Point R11.0791
Daily Pivot Point R21.0846
Daily Pivot Point R31.0875

Author

Akhtar Faruqui

Akhtar Faruqui is a Forex Analyst based in New Delhi, India. With a keen eye for market trends and a passion for dissecting complex financial dynamics, he is dedicated to delivering accurate and insightful Forex news and analysis.

More from Akhtar Faruqui
Share:

Editor's Picks

EUR/USD risks a deeper drop below 1.1750

EUR/USD keeps its vacillating mood in place as the the NA session drwas to a close on Tuesday, hovering below the 1.1800 hurdle amid acceptable gains in the US Dollar. In the meantime, market participants and the FX galaxy are expected to closely follow President Trump’s SOTU speech around 2AM GMT.
 

GBP/USD regains 1.3500 and above

GBP/USD extends its advance for the third day in a row on Tuesday, this time retesting the area beyond the 1.3500 hurdle. Cable’s uptick comes despite decent gains in the Greenback and the dovish message from the BoE’s Bailey at the UK Parliament.

Gold appears offered around $5,150

Gold is giving back a good portion of the recent multi-day rally, receding to the $5,150 zone per troy ounce amid the decent bounce in the US Dollar and mixed US Treasuty yields. In the meantime, markets’ attention remain on upcoming comments from Fed speakers.

Ripple’s DeFi shift in focus: Navigating XRPL EVM sidechain growth, XRPFi migration and liquidity
Ripple (XRP) has continued to trade under pressure, extending its decline by approximately 63% from the record high of $3.66 in July. The remittance token is trading above support at $1.35, while its upside appears limited by key supply zones, starting with $1.40, at the time of writing on Tuesday.
The Citrini report: How a debatable AI narrative can shake Wall Street

That AI-related headline alone was enough to rattle investors.US stocks slid sharply on Monday after a widely circulated Citrini Research memo outlined a hypothetical “2028 Global Intelligence Crisis”, warning that rapid AI adoption could push US unemployment into double digits as early as by mid-2028.

XRP pressured by weak ETF flows and declining retail interest

Ripple (XRP) is edging lower, trading above its intraday low of $1.32 at the time of writing on Tuesday. The decline from its weekly opening of $1.39 reflects heightened volatility in the broader cryptocurrency market, accentuated by tariff-triggered uncertainty.