EUR/USD Price Analysis: Recovery remains capped below 1.1370, bears flexing muscles
- EUR/USD pares the biggest daily loss in two weeks inside a choppy range.
- Steady RSI, bullish MACD signals keep buyer hopeful.
- Six-week-old descending trend line joins nearby horizontal hurdle to challenge upside.
- Ascending triangles formation could offer fresh yearly low on break of 1.1240.

EUR/USD grinds lower around 1.1300 after posting the biggest daily fall in a fortnight. The major currency pair reversed from the 21-day EMA the previous day but stays inside a bearish chart pattern during early Friday morning in Asia.
It’s worth noting that the bullish MACD signals and firmer RSI favor the buyers but 21-day EMA, around 1.1340, acts as an immediate hurdle to recovery moves.
Adding to the upside filters, actually being a major hurdle, is the joint of a descending trend line from late October and the upper line of the stated three-week-long ascending triangle, around 1.1370.
Should the quote jumps past 1.1370, odds of its run-up to a descending resistance line from September, near 1.1520 can’t be ruled out.
Alternatively, a downside break of the triangle’s support, at 1.1240 by the press time, will initially attack the yearly low of 1.1186 during the theoretical slump towards 1.1050.
To sum up, EUR/USD struggles for a clear direction but bears have the upper hand.
EUR/USD: Daily chart
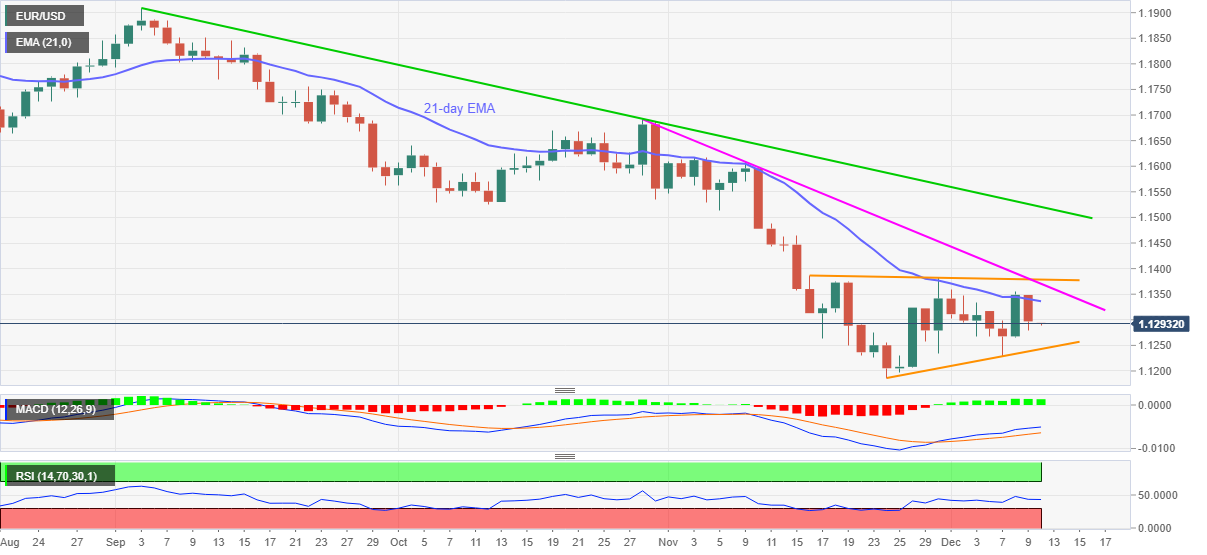
Trend: Sideways
Author

Anil Panchal
FXStreet
Anil Panchal has nearly 15 years of experience in tracking financial markets. With a keen interest in macroeconomics, Anil aptly tracks global news/updates and stays well-informed about the global financial moves and their implications.


