EUR/USD Price Analysis: Rebounds near 1.6000 major lined up with 14-day EMA support
- EUR/USD aims to retrace the recent losses despite adverse PMI data.
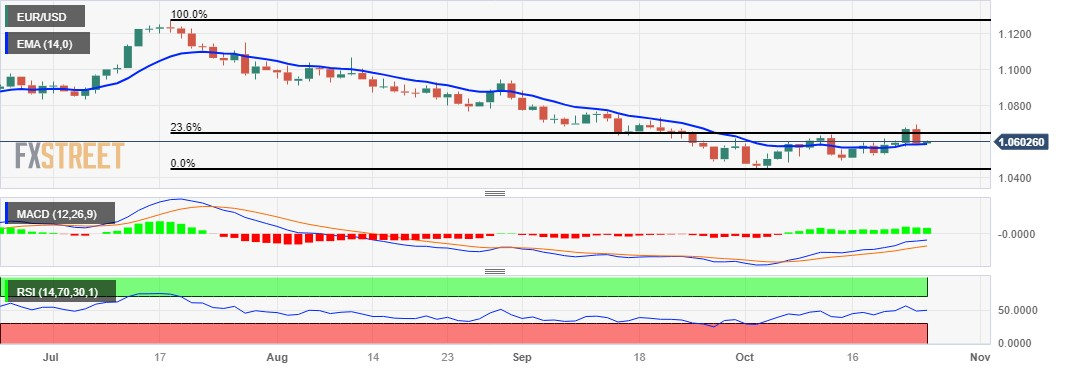
- RSI indicates a bearish momentum; MACD suggests a momentum shift.
- 23.6% Fibonacci retracement at 1.0643 emerges as the barrier followed by the monthly high.

EUR/USD attempts to regain the upward direction post losses registered in the previous session due to weaker Eurozone PMI and upbeat S&P Global PMI from the United States (US).
The preliminary HCOB Composite PMI for the eurozone declined to 46.5 in October, down from 47.2 in September. This marks the sixth consecutive reading below 50, indicating a persistent slowdown.
The Manufacturing PMI dropped to 43.0, compared to the previous reading of 43.4 and falling short of the expected 43.7. Additionally, the Services PMI decreased to 47.8 from the previous 48.7.
On the US side, the S&P Global Composite PMI showed growth in October, rising from 50.2 to 51.0. The Services PMI experienced an increase, reaching 50.9, while the Manufacturing PMI rose to 50.0. This marks the first time in the last six months that manufacturing has sustained a level above the 50-point threshold, signaling a positive shift in that sector.
EUR/USD trades higher around the 1.0600 psychological level during the Asian session on Wednesday. The pair receives upward support on the decline in the US Dollar (USD), coupled with an improved risk sentiment and stable US Dollar post recent gains.
The 23.6% Fibonacci retracement at 1.0643 emerges as the key resistance followed by the monthly high at 1.0694, which is aligned with the major level at 1.0700.
A break above the latter could open the doors for the EUR/USD pair to explore the region around the 1.0750 psychological level.
On the downside, the EUR/USD pair could meet the support around the 14-day Exponential Moving Average (EMA) at 1.0586, followed by the 1.0550 psychological level.
The Moving Average Convergence Divergence (MACD) line positions below the centerline, indicating that the short-term average is below the long-term average. However, an intriguing development is emerging as the line diverges above the signal line, suggesting the possibility of a momentum shift towards a bullish trend.
On the other hand, the EUR/USD pair suggests a bearish momentum, with a discernible weaker bias highlighted in the 14-day Relative Strength Index (RSI), which is below the 50 level.
EUR/USD: Daily Chart
(This story was corrected on October 25 at 09:50 GMT to say that the US Manufacturing PMI came in at or above 50 for the first time in six months. A previous version of the story said that the PMI had remained above 50 for the last six months.)
Author

Akhtar Faruqui
FXStreet
Akhtar Faruqui is a Forex Analyst based in New Delhi, India. With a keen eye for market trends and a passion for dissecting complex financial dynamics, he is dedicated to delivering accurate and insightful Forex news and analysis.


