EUR/USD Price Analysis: Portrays bullish flag on 4-hour chart
- EUR/USD fades recovery from 1.1220, takes a U-turn from 1.1252.
- A weekly support line, 200-bar SMA can question immediate pullback.
- Bulls will look for entry beyond 1.1290, downside break of channel formation could defy the bullish chart pattern.
- MACD signals favor buyers to keep a positive outlook.

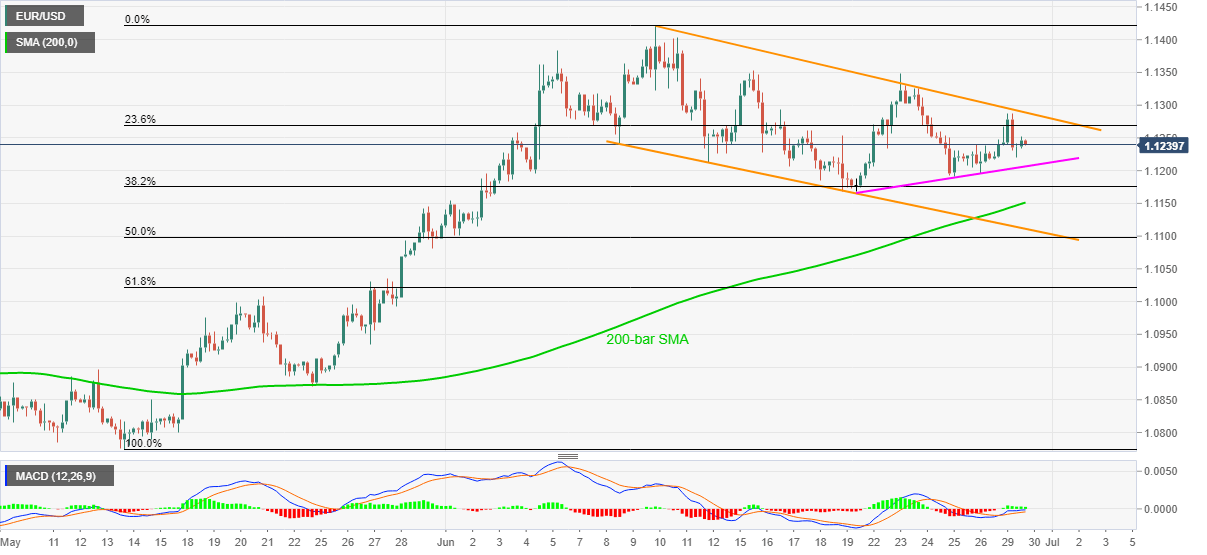
EUR/USD declines to 1.1240 during the initial hour of Tokyo open on Tuesday. The pair earlier stretched pullback moves from 1.1220 till 1.1252. Even so, the quote portrays a short-term bullish flash on the four-hour chart while looking at its rise from mid-May and gradual weakness after June 10.
Other than the bullish chart formation, the MACD histogram is also supporting the buyers. However, a clear break of the immediate falling channel’s resistance, currently around 1.1290, becomes necessary for the pair to aim for the March month high around 1.1500. During the rise, the quote may take intermediate halts around 1.1250 and 1.1425.
On the contrary, an ascending trend line from June 21, at 1.1205 now, followed by a 200-bar SMA level of 1.1150, may challenge the sellers before dragging them to the said channel’s support near 1.1110.
In a case where the EUR/USD prices slip below 1.1110, the bullish pattern gets defies and the bear could aim for May 21 top near 1.1010.
EUR/USD four-hour chart
Trend: Further recovery expected
Author

Anil Panchal
FXStreet
Anil Panchal has nearly 15 years of experience in tracking financial markets. With a keen interest in macroeconomics, Anil aptly tracks global news/updates and stays well-informed about the global financial moves and their implications.


