EUR/USD Price Analysis: On track to hit the lowest since Dec. 1
EUR/USD's technical chart shows bears are in control and could soon push the pair to three-month lows below the Feb. 5 low of 1.1952.
The pair formed a bearish marubozu candle on Thursday – a sign of a strong bearish mood in the market – validating a bear flag disruption confirmed earlier this week.
A bearish marubozu or a big red candle with little or no wicks appears when sellers pretty much dominate the proceedings. The pair dived out of a bear flag on March 3, signaling an extension a resumption of the sell-off from the Jan. 6 high of 1.2349 and opening the doors for a drop below 1.20.
A close above the lower high of 1.2243 created on Feb. 25 is needed to confirm a reversal higher.
Daily chart
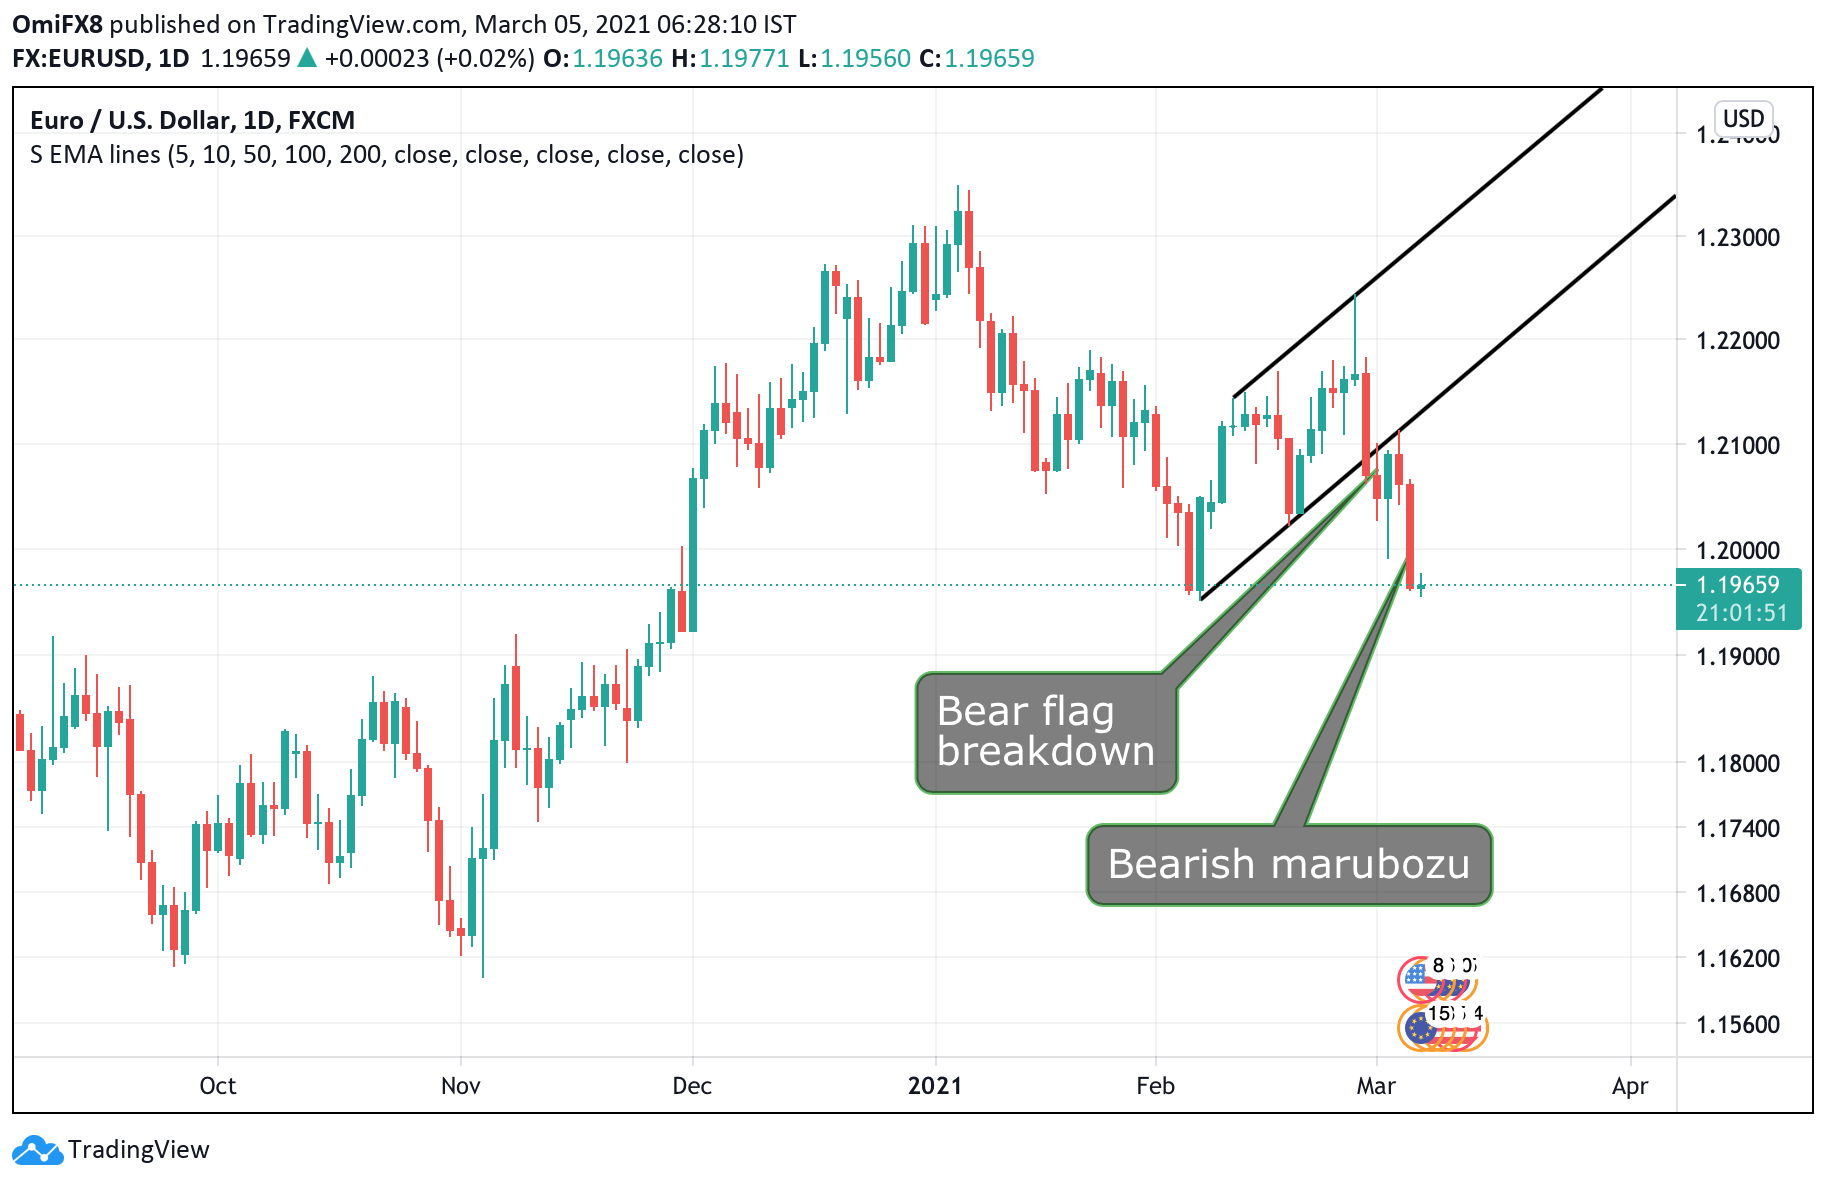
Trend: Bearish
Technical levels
Author

Omkar Godbole
FXStreet Contributor
Omkar Godbole, editor and analyst, joined FXStreet after four years as a research analyst at several Indian brokerage companies.


