EUR/USD Price Analysis: Marches firmly towards parity, though remains downward biased


  • EUR/USD is closing towards the parity on speculations that the Fed could shift “dovish.”
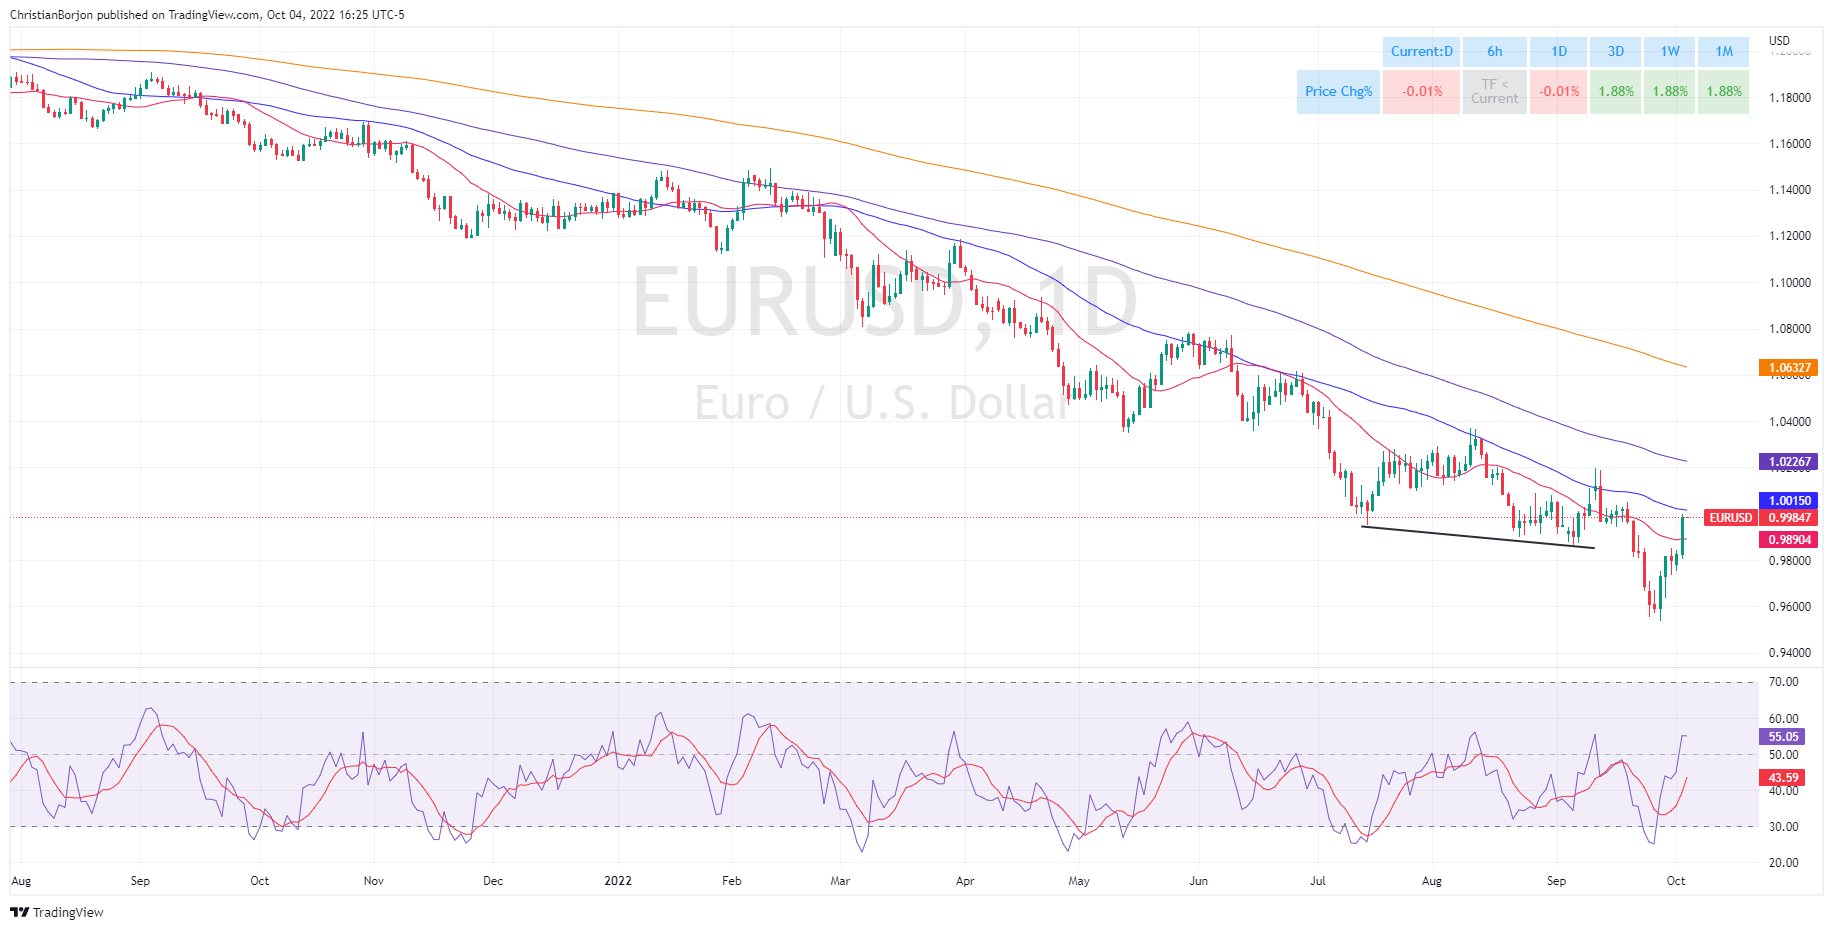
  • The EUR/USD continues its recovery, though shy of breaking the 50-day EMA above parity.
  • For the EUR/USD to shift neutral, it needs to clear 1.0226; otherwise, the bias remains downwards.

The shared currency continues its recovery against the greenback, as the EUR/USD cleared the 20-day EMA at 0.9891 and climbed towards the 50-day EMA, though it fell short of reaching it, printing a daily high at 0.9997. At the time of writing, the EUR/USD is trading at 0.9984, up by 1.66%.

The EUR/USD extended its recovery due to some fundamental reasons. US Treasury bond yields edge lower as speculations of central banks tightening at a slower pace grew as reflected by a risk-on impulse. Therefore, as shown by the US Dollar Index, the greenback dropped from its YTD high at 114.77, to 110.184, at the time of typing.

EUR/USD Price Analysis: Technical outlook

The EUR/USD daily chart delineates that the euro, even though it recovered from two-decade lows, it is still downward biased. The major could shift its bias to neutral if it clears the 100-day EMA at 1.0226 and would shift bullish if the pair is back above 1.0615, which could pave the way for a 200-day EMA test at 1.0632. That said, failure at parity or the 50-day EMA at 1.0015 would expose the EUR/USD to selling pressure.

Therefore, the EUR/USD first support would be 0.9900, closely followed by the 20-day EMA at 0.9890. A breach of the latter will expose the 0.9800 figure, followed by the YTD low at 0.9635.

EUR/USD Key Technical Levels

EUR/USD

Overview
Today last price 0.9984
Today Daily Change 0.0162
Today Daily Change % 1.65
Today daily open 0.9825
 
Trends
Daily SMA20 0.9889
Daily SMA50 1.0023
Daily SMA100 1.0239
Daily SMA200 1.0648
 
Levels
Previous Daily High 0.9845
Previous Daily Low 0.9753
Previous Weekly High 0.9854
Previous Weekly Low 0.9536
Previous Monthly High 1.0198
Previous Monthly Low 0.9536
Daily Fibonacci 38.2% 0.981
Daily Fibonacci 61.8% 0.9788
Daily Pivot Point S1 0.977
Daily Pivot Point S2 0.9716
Daily Pivot Point S3 0.9679
Daily Pivot Point R1 0.9862
Daily Pivot Point R2 0.99
Daily Pivot Point R3 0.9954


Share: Feed news

Information on these pages contains forward-looking statements that involve risks and uncertainties. Markets and instruments profiled on this page are for informational purposes only and should not in any way come across as a recommendation to buy or sell in these assets. You should do your own thorough research before making any investment decisions. FXStreet does not in any way guarantee that this information is free from mistakes, errors, or material misstatements. It also does not guarantee that this information is of a timely nature. Investing in Open Markets involves a great deal of risk, including the loss of all or a portion of your investment, as well as emotional distress. All risks, losses and costs associated with investing, including total loss of principal, are your responsibility. The views and opinions expressed in this article are those of the authors and do not necessarily reflect the official policy or position of FXStreet nor its advertisers. The author will not be held responsible for information that is found at the end of links posted on this page.

If not otherwise explicitly mentioned in the body of the article, at the time of writing, the author has no position in any stock mentioned in this article and no business relationship with any company mentioned. The author has not received compensation for writing this article, other than from FXStreet.

FXStreet and the author do not provide personalized recommendations. The author makes no representations as to the accuracy, completeness, or suitability of this information. FXStreet and the author will not be liable for any errors, omissions or any losses, injuries or damages arising from this information and its display or use. Errors and omissions excepted.

The author and FXStreet are not registered investment advisors and nothing in this article is intended to be investment advice.

Recommended content


Recommended content

Editors’ Picks

AUD/USD risks a deeper drop in the short term

AUD/USD risks a deeper drop in the short term

AUD/USD rapidly left behind Wednesday’s decent advance and resumed its downward trend on the back of the intense buying pressure in the greenback, while mixed results from the domestic labour market report failed to lend support to AUD.

AUD/USD News

EUR/USD leaves the door open to a decline to 1.0600

EUR/USD leaves the door open to a decline to 1.0600

A decent comeback in the Greenback lured sellers back into the market, motivating EUR/USD to give away the earlier advance to weekly tops around 1.0690 and shift its attention to a potential revisit of the 1.0600 neighbourhood instead.

EUR/USD News

Gold is closely monitoring geopolitics

Gold is closely monitoring geopolitics

Gold trades in positive territory above $2,380 on Thursday. Although the benchmark 10-year US Treasury bond yield holds steady following upbeat US data, XAU/USD continues to stretch higher on growing fears over a deepening conflict in the Middle East.

Gold News

Bitcoin price shows strength as IMF attests to spread and intensity of BTC transactions ahead of halving

Bitcoin price shows strength as IMF attests to spread and intensity of BTC transactions ahead of halving

Bitcoin (BTC) price is borderline strong and weak with the brunt of the weakness being felt by altcoins. Regarding strength, it continues to close above the $60,000 threshold for seven weeks in a row.

Read more

Is the Biden administration trying to destroy the Dollar?

Is the Biden administration trying to destroy the Dollar?

Confidence in Western financial markets has already been shaken enough by the 20% devaluation of the dollar over the last few years. But now the European Commission wants to hand Ukraine $300 billion seized from Russia.

Read more

Forex MAJORS

Cryptocurrencies

Signatures