EUR/USD Price Analysis: Immediate resistance appears at nine-day EMA above 1.0400
- EUR/USD may depreciate further as the short-term price momentum is weaker.
- The initial support appears at its two-year low of 1.0332, recorded on November 22.
- The nine-day EMA acts as immediate resistance at the 1.0417 level.

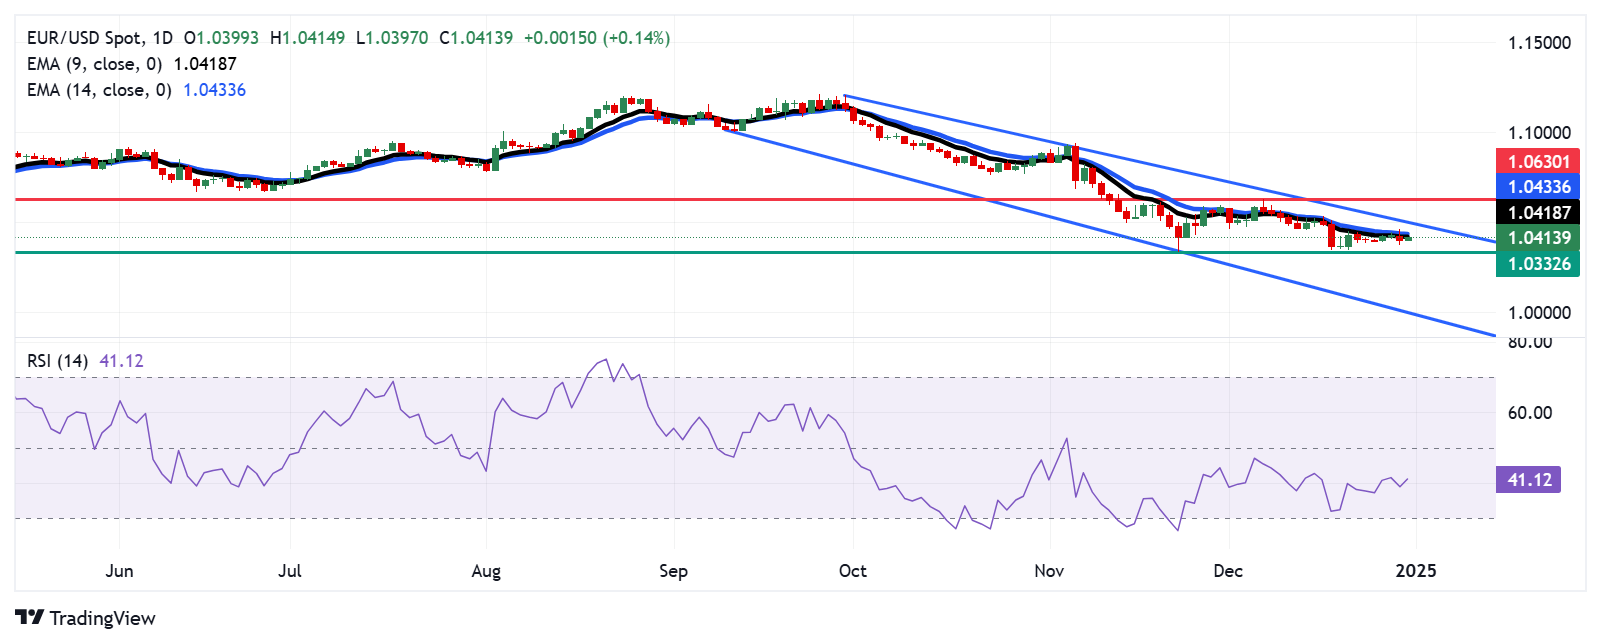
EUR/USD recovers its recent losses from the previous session, trading around 1.0410 during the European hours on Tuesday. A review of the daily chart shows an ongoing bearish bias as the pair is confined within a descending channel pattern.
The 14-day Relative Strength Index (RSI), a key momentum indicator, remains below the 50 level, confirming the persistent bearish sentiment for the EUR/USD pair. Additionally, the nine-day Exponential Moving Average (EMA) is below the 14-day EMA, suggesting the short-term price momentum is weaker.
On the downside, the two-year low at 1.0332, which was recorded on November 22, appears as a primary support for the EUR/USD pair. A successful break below this level could reinforce the bearish bias and put downward pressure on the pair to navigate the area around the lower boundary of the descending channel at the 1.0010 level.
In terms of resistance, the EUR/USD pair tests an immediate barrier at the nine-day Exponential Moving Average (EMA) of the 1.0417 level, followed by the 14-day EMA at the 1.0433 level. A breakthrough above these EMAs could lead the pair to approach the descending channel’s upper boundary at 1.0500, followed by its seven-week high of 1.0630 level.
EUR/USD: Daily Chart
Euro PRICE Today
The table below shows the percentage change of Euro (EUR) against listed major currencies today. Euro was the strongest against the New Zealand Dollar.
| USD | EUR | GBP | JPY | CAD | AUD | NZD | CHF | |
|---|---|---|---|---|---|---|---|---|
| USD | -0.15% | -0.04% | -0.42% | 0.09% | 0.13% | 0.23% | -0.12% | |
| EUR | 0.15% | 0.12% | -0.23% | 0.25% | 0.28% | 0.39% | 0.03% | |
| GBP | 0.04% | -0.12% | -0.39% | 0.12% | 0.17% | 0.28% | -0.09% | |
| JPY | 0.42% | 0.23% | 0.39% | 0.54% | 0.56% | 0.65% | 0.33% | |
| CAD | -0.09% | -0.25% | -0.12% | -0.54% | 0.03% | 0.14% | -0.22% | |
| AUD | -0.13% | -0.28% | -0.17% | -0.56% | -0.03% | 0.10% | -0.25% | |
| NZD | -0.23% | -0.39% | -0.28% | -0.65% | -0.14% | -0.10% | -0.35% | |
| CHF | 0.12% | -0.03% | 0.09% | -0.33% | 0.22% | 0.25% | 0.35% |
The heat map shows percentage changes of major currencies against each other. The base currency is picked from the left column, while the quote currency is picked from the top row. For example, if you pick the Euro from the left column and move along the horizontal line to the US Dollar, the percentage change displayed in the box will represent EUR (base)/USD (quote).
Author

Akhtar Faruqui
FXStreet
Akhtar Faruqui is a Forex Analyst based in New Delhi, India. With a keen eye for market trends and a passion for dissecting complex financial dynamics, he is dedicated to delivering accurate and insightful Forex news and analysis.


