|

EUR/USD Price Analysis: Holds above the 1.0800 mark, upside seems limited

  • EUR/USD holds below the 50- and 100-day EMAs on a four-hour chart.
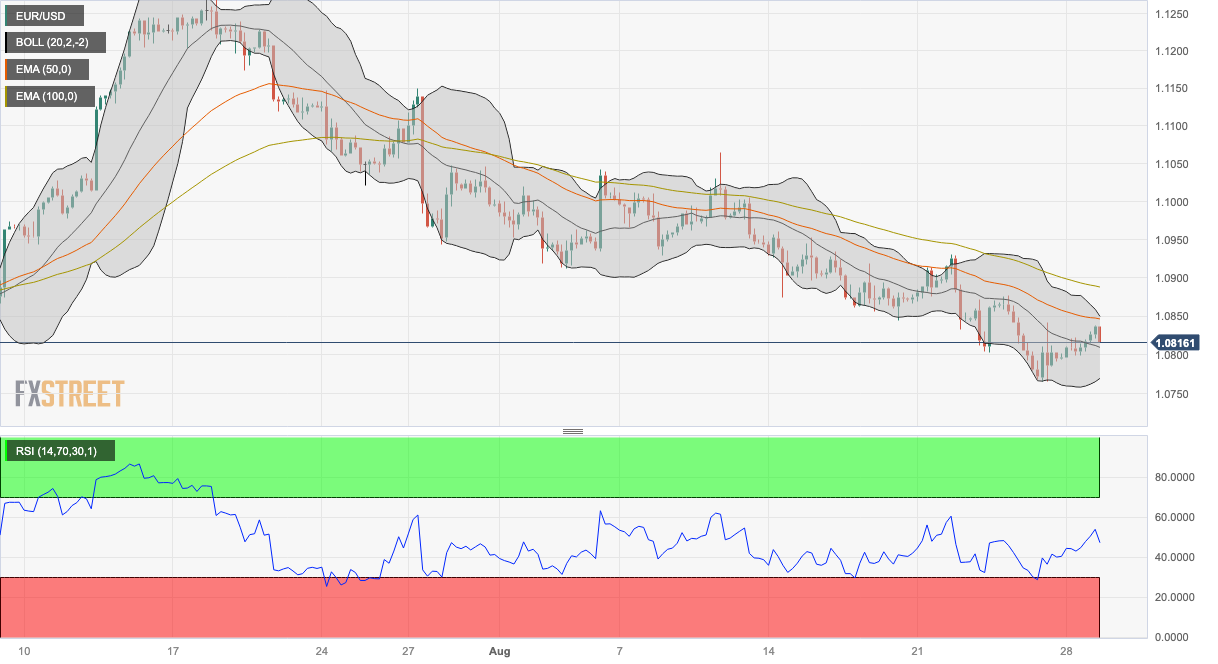
  • The Relative Strength Index (RSI) remains in bearish territory.
  • The first resistance level appears at 1.0845-1.0850 region; the key support level to watch is 1.0800.

The EUR/USD pair recovers some lost ground but the upside seem limited during the early European session on Tuesday. The major pair currently trades near 1.0816, losing 0.03% on the day. The odds of additional interest rate hikes by the Federal Reserve (Fed) lift US bond yields and limit USD losses.

According to the four-hour chart, the major pair holds below the 50- and 100-day Exponential Moving Averages (EMAs), implying the path of least resistance for the EUR/USD is to the downside. Adding to this, the Relative Strength Index (RSI) remains below 50, supporting EUR/USD sellers for now.

The immediate resistance level for EUR/USD appears at 1.0845-1.0850 region, representing a confluence of the 50-hour EMA and the upper boundary of the Bollinger Band. Further north, the pair will challenge the next hurdle at 1.0890 (100-hour EMA).

Any meaningful follow-through buying beyond the latter could pave the way to the next barrier at 1.0930 (a high of August 22) en route to 1.1000 (a psychological round mark, a high of August 8)and finally at 1.1065 (a high of August 10).

On the flip side, the key support level to watch is 1.0800, portraying a psychological round mark and a low of August 23. The additional downside stop is near the limit of the Bollinger Band and a low of August 25 at the 1.0765-1.0770 region. A decisive break below the latter would fuel a drop towards 1.0735 (a low of June 12) and 1.0675 (a low of June 6).
 

EUR/USD one-hour chart

EUR/USD

Overview
Today last price1.0818
Today Daily Change-0.0001
Today Daily Change %-0.01
Today daily open1.0819
 
Trends
Daily SMA201.091
Daily SMA501.0975
Daily SMA1001.0927
Daily SMA2001.0806
 
Levels
Previous Daily High1.0822
Previous Daily Low1.0794
Previous Weekly High1.093
Previous Weekly Low1.0766
Previous Monthly High1.1276
Previous Monthly Low1.0834
Daily Fibonacci 38.2%1.0811
Daily Fibonacci 61.8%1.0805
Daily Pivot Point S11.0801
Daily Pivot Point S21.0783
Daily Pivot Point S31.0772
Daily Pivot Point R11.083
Daily Pivot Point R21.084
Daily Pivot Point R31.0859

Author

Lallalit Srijandorn

Lallalit Srijandorn is a Parisian at heart. She has lived in France since 2019 and now becomes a digital entrepreneur based in Paris and Bangkok.

More from Lallalit Srijandorn
Share:

Markets move fast. We move first.

Orange Juice Newsletter brings you expert driven insights - not headlines. Every day on your inbox.

By subscribing you agree to our Terms and conditions.

Editor's Picks

EUR/USD stays defensive below 1.1750 as USD finds its feet

EUR/USD kicks off the new week on a softer note, holding below 1.1750 in European trading on Monday. The pair faces challenges due to a pause in the US Dollar downtrend, with traders shifting their focus to the delayed US Nonfarm Payrolls and CPI data for fresh directives. The ECB policy decision is also eagerly awaited. 

GBP/USD holds steady above 1.3350 as traders await key data and BoE

GBP/USD remains on the back foot above 1.3350 in the European session on Monday, though it lacks bearish conviction and holds above the key 200-day SMA support. The US Dollar holds its recovery mode ahead of key data releases, while the Pound Sterling faces headwinds from the expected BoE rate cut this week. 

Gold climbs to seven-week highs on Fed rate cut bets, safe-haven demand

Gold price rises to seven-week highs to near $4,350 during the early European trading hours on Monday. The precious metal extends its upside amid the prospect of interest rate cuts by the US Fed next year. Lower interest rates could reduce the opportunity cost of holding Gold, supporting the non-yielding precious metal.

Solana consolidates as spot ETF inflows near $1 billion signal institutional dip-buying

Solana price hovers above $131 at the time of writing on Monday, nearing the upper boundary of a falling wedge pattern, awaiting a decisive breakout. On the institutional side, demand for spot Solana Exchange-Traded Funds remained firm, pushing total assets under management to nearly $1 billion since launch. 

Big week ends with big doubts

The S&P 500 continued to push higher yesterday as the US 2-year yield wavered around the 3.50% mark following a Federal Reserve (Fed) rate cut earlier this week that was ultimately perceived as not that hawkish after all. The cut is especially boosting the non-tech pockets of the market.

Solana Price Forecast: SOL consolidates as spot ETF inflows near $1 billion signal institutional dip-buying

Solana (SOL) price hovers above $131 at the time of writing on Monday, nearing the upper boundary of a falling wedge pattern, awaiting a decisive breakout.