|
EUR/USD Price Analysis: Euro slumps after reaching highest since August
- EUR/USD is pulling back down sharply in the New York session.
- Resistance is seen at the 1.1132, 1.1155 and 1.1178 price levels.

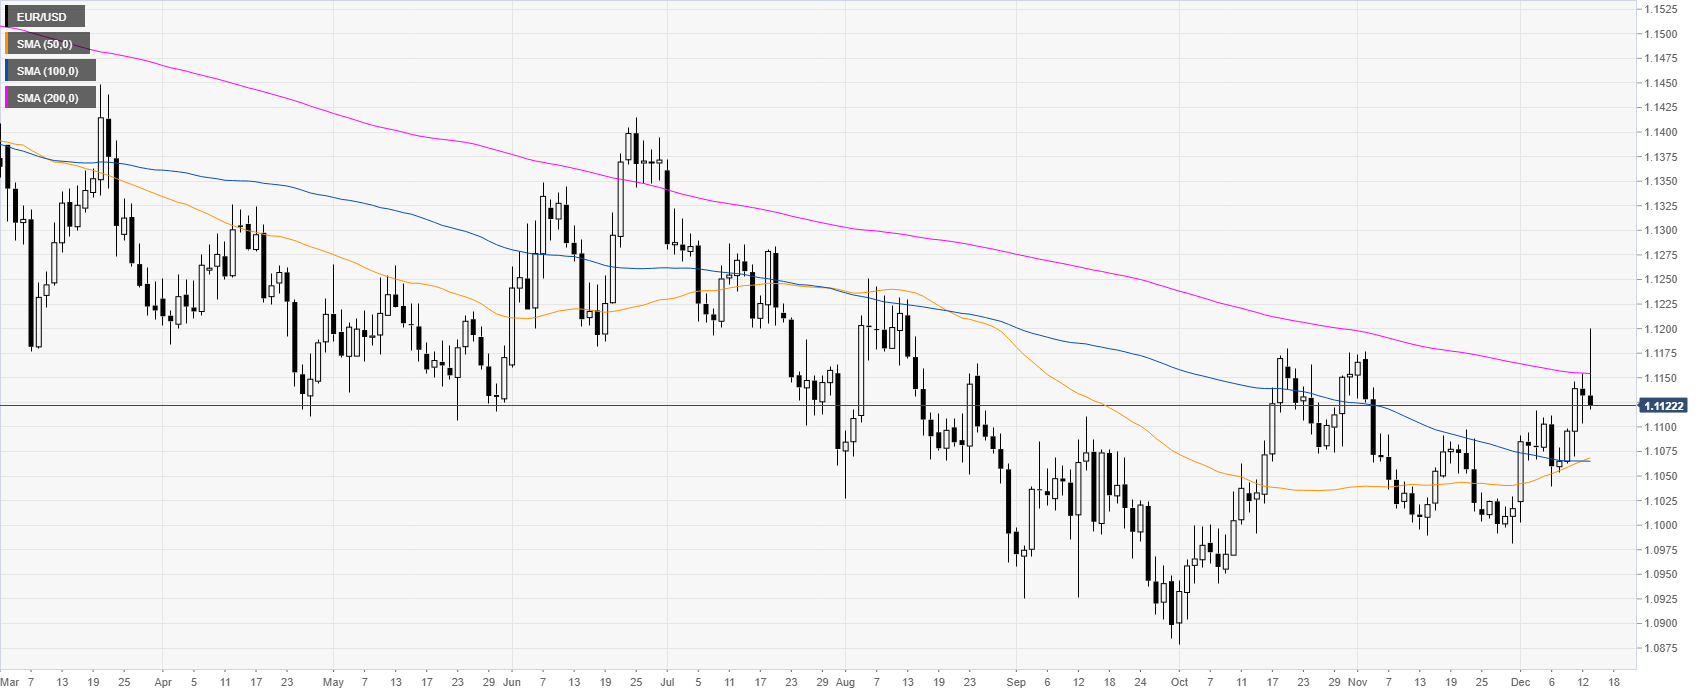
EUR/USD daily chart
After peaking at its highest since August, EUR/USD is reversing course while rejecting the 200-day simple moving average (DMA).
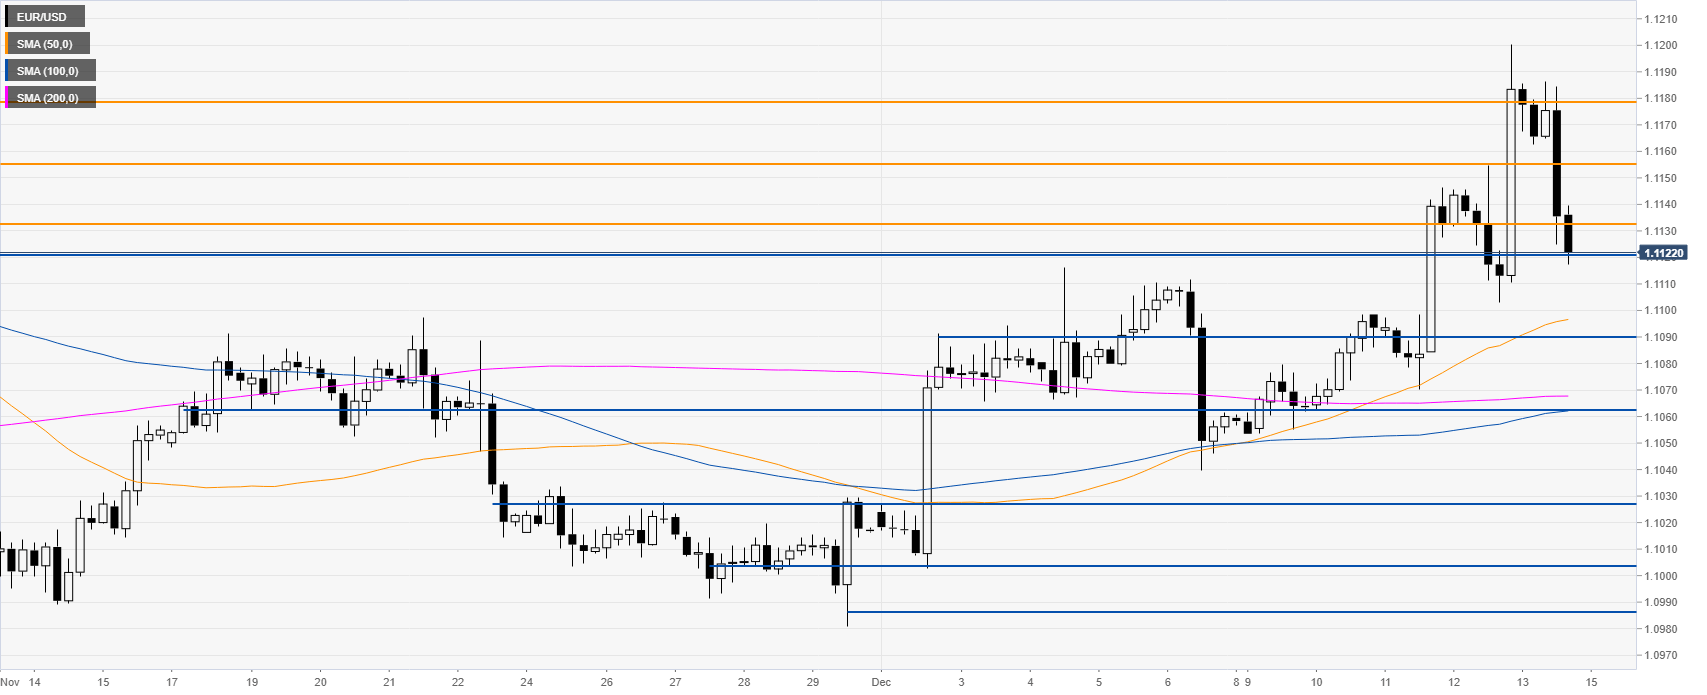
EUR/USD four-hour chart
The spot is reversing sharply to the downside while challenging the 1.1120 support level above the main SMAs. If the bears gather enough strength and break below this support, the market could decline towards the 1.1090, 1.1062 and 1.1027 price levels, according to the Technical Confluences Indicator.
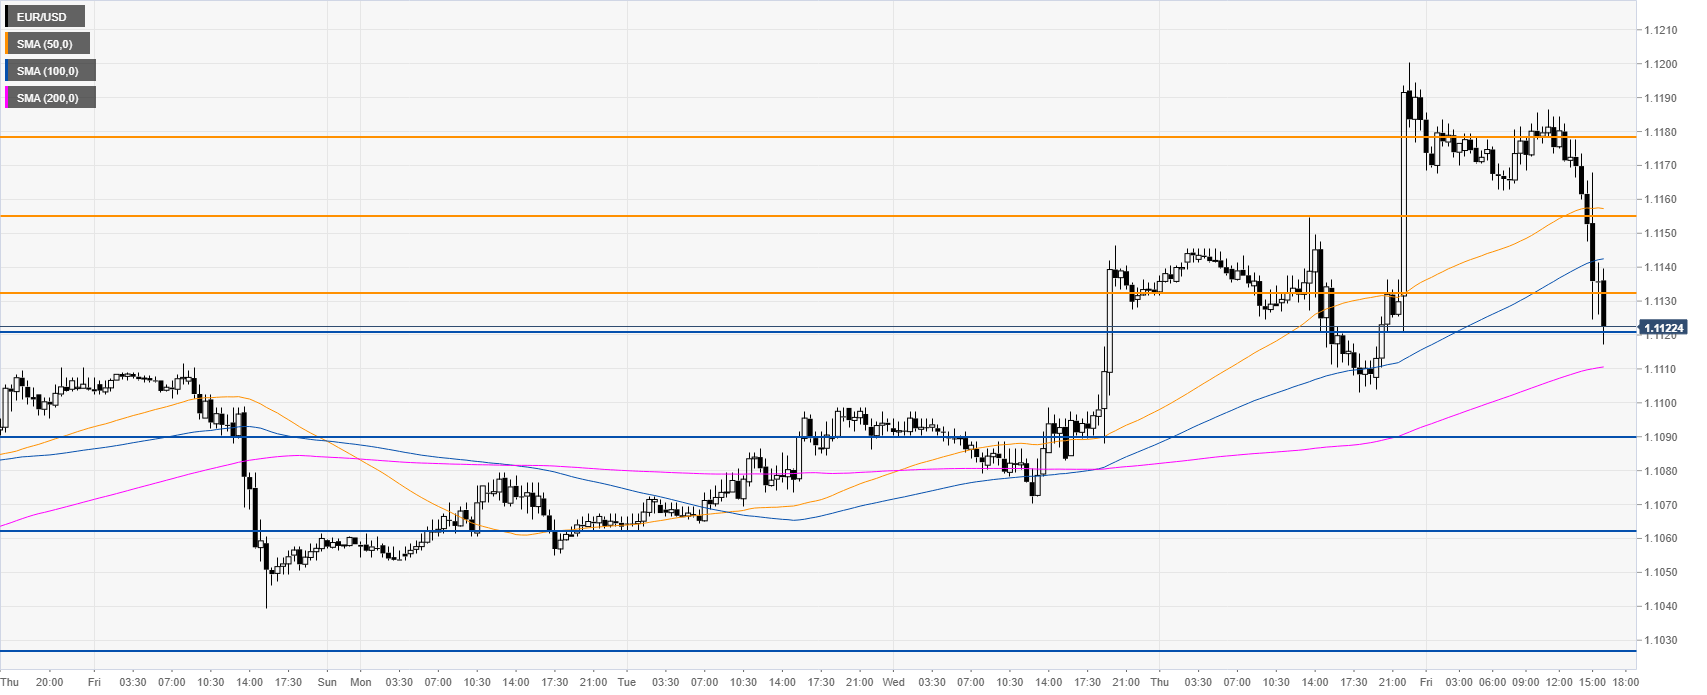
EUR/USD 30-minute chart
The euro is trading below the 100 and 200 SMAs as the market is correcting down. Resistance is seen at the 1.1132, 1.1155 and 1.1178 price levels, according to the Technical Confluences Indicator.
Additional key levels
Author

Flavio Tosti
Independent Analyst
More from Flavio Tosti


