|

EUR/USD Price Analysis: Euro pressuring 2020 highs and nearing 1.1500 figure

  • EUR/USD bullish pressure remains unabated after the London close. 
  • The level to beat for bulls is the 1.1471 resistance.
 

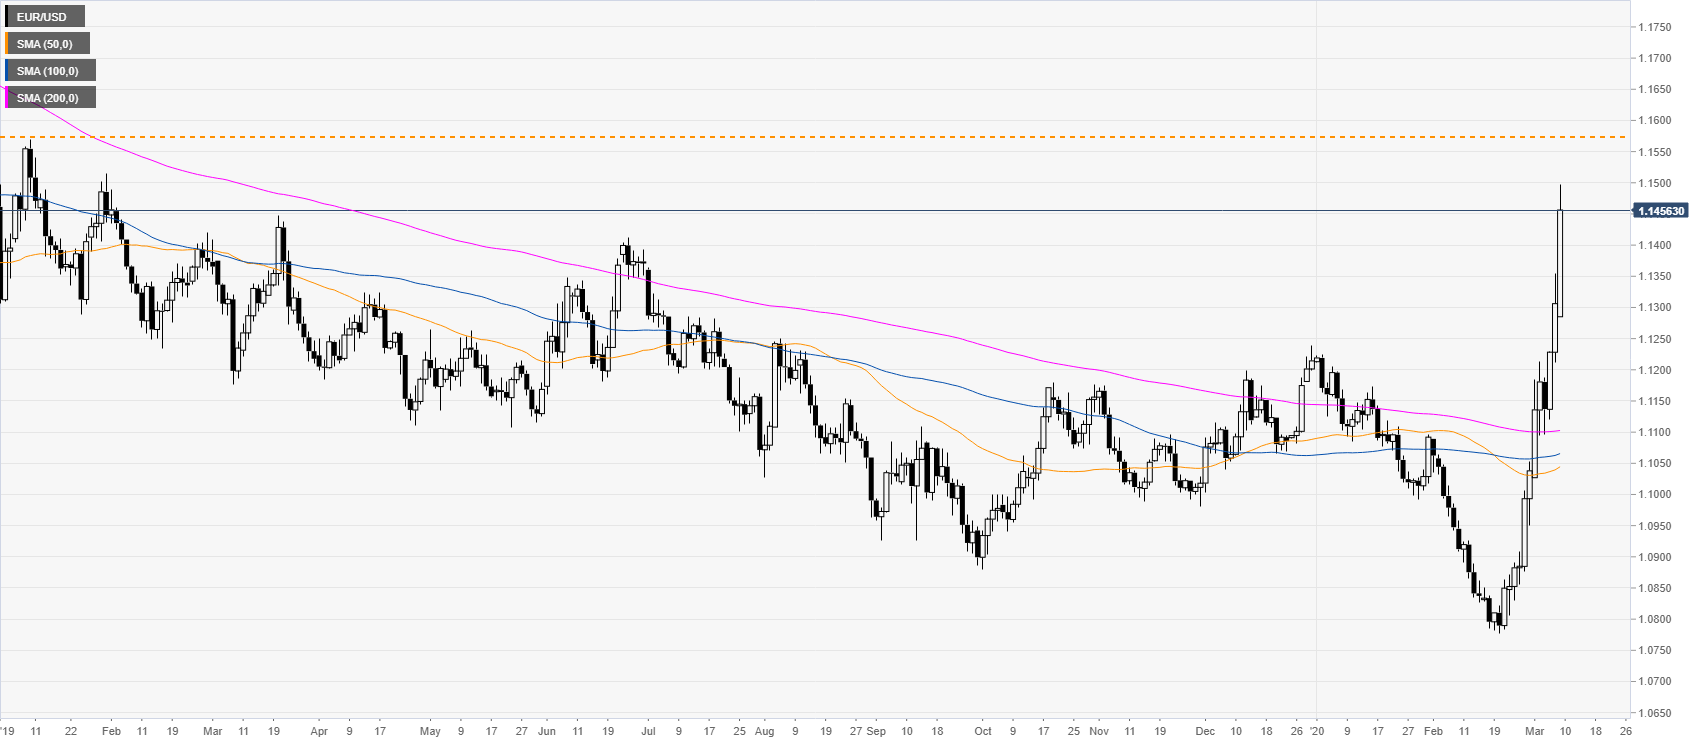
EUR/USD weekly chart 

 
EUR/USD is reversing up sharply from 34-month lows as the spot is virtually erasing the 2019 losses in about three weeks of trading. There are no signs that the spot might slow down and a spike to the 2019 highs in the 1.1569/1.6000 price zone remains on the cards.
 

EUR/USD four-hour chart

 
EUR/USD is pressuring the 1.1471 resistance as the London session came to an end. As the bulls remain in control EUR/USD has room to climb towards the 1.1518 and 1.1566 price levels. Support can emerge near the 1.1400/1.1363 price zone and 1.1300 figure, according to the Technical Confluences Indicator.   
 
 
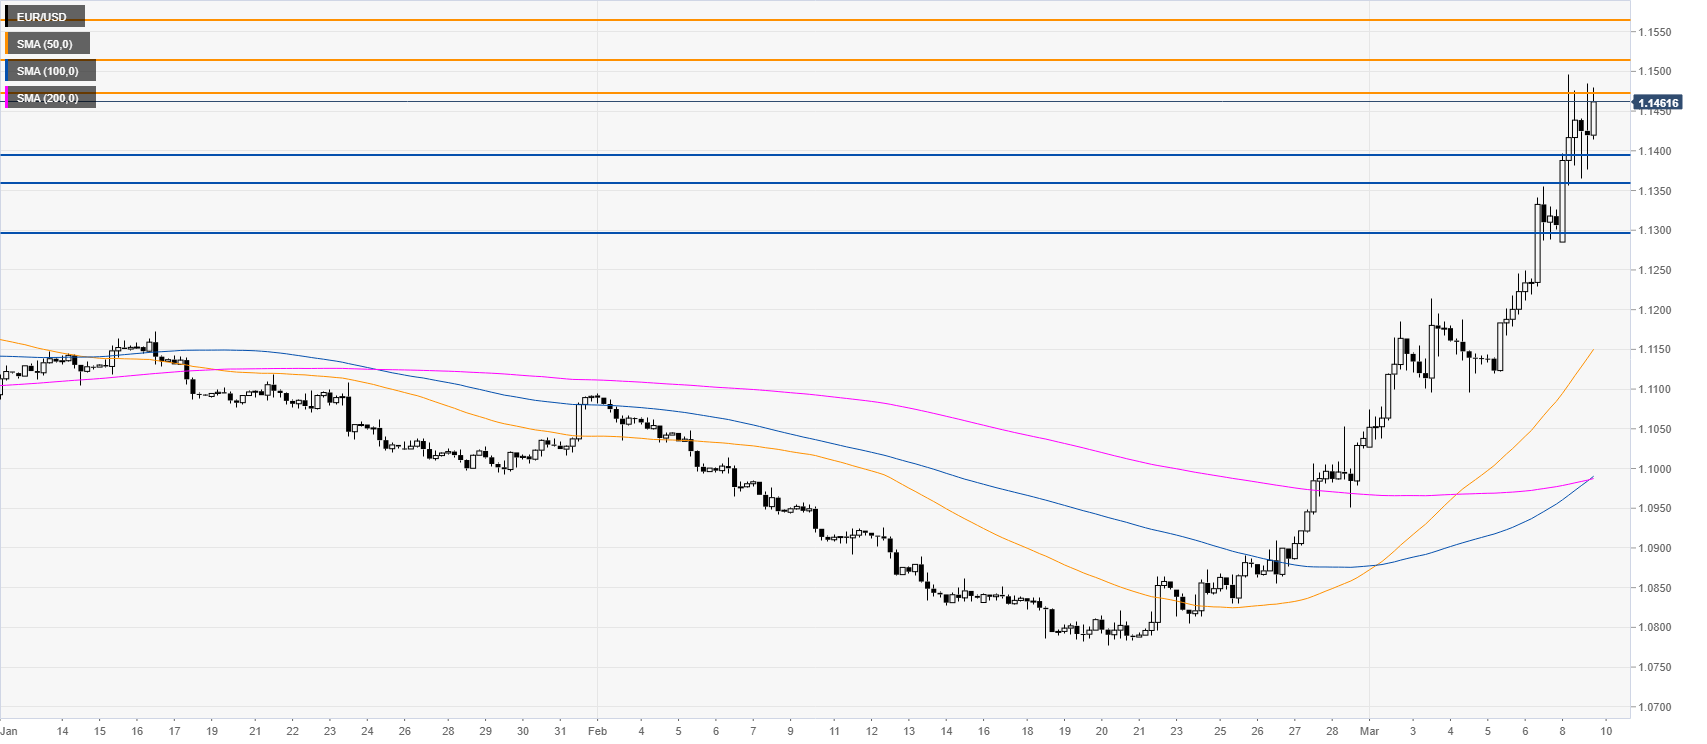
Resistance: 1.1471, 1.1518, 1.1566
Support: 1.1400, 1.1363, 1.1300
 

Additional key levels

EUR/USD

Overview
Today last price1.1439
Today Daily Change0.0133
Today Daily Change %1.18
Today daily open1.1306
 
Trends
Daily SMA201.0955
Daily SMA501.1039
Daily SMA1001.1062
Daily SMA2001.1101
 
Levels
Previous Daily High1.1355
Previous Daily Low1.1212
Previous Weekly High1.1355
Previous Weekly Low1.1027
Previous Monthly High1.1089
Previous Monthly Low1.0778
Daily Fibonacci 38.2%1.13
Daily Fibonacci 61.8%1.1266
Daily Pivot Point S11.1227
Daily Pivot Point S21.1148
Daily Pivot Point S31.1084
Daily Pivot Point R11.137
Daily Pivot Point R21.1434
Daily Pivot Point R31.1513

Author

Flavio Tosti

Flavio Tosti

Independent Analyst


More from Flavio Tosti
Share:

Editor's Picks

EUR/USD seems fragile below 1.1700 as Middle East war boosts energy prices

The EUR/USD pair trades flat at around 1.1680 during the Asian trading session on Tuesday, but broadly seems vulnerable, being close to its five-week low. The major currency pair is under pressure as surging oil prices due to the United States-Israel war with Iran have increased the risks of higher inflation for the Old Continent.

GBP/USD hovers around 1.3400 with bearish pressure intact

GBP/USD edges higher after three days of losses, trading around 1.3400 during the Asian hours on Tuesday. The technical analysis of the daily chart indicates an ongoing bearish bias, as the pair trades within a descending channel pattern.

Gold stays bullish as Iran war continues to spur safe-haven flows

Gold is finding renewed bids in Asian trades on Tuesday, making another attempt to regain the $5,400 level amid persistent demand for safe-haven assets as the Iran war extends. A softer risk tone remains in play as US President Donald Trump continues to threaten deeper escalation to the ongoing war with Iran, warning that a “big wave” is yet to come.

Top Crypto Gainers: Near Protocol, Virtuals Protocol, and Morpho lead market recovery

Near Protocol, Virtuals Protocol, and Morpho are leading the market recovery with double-digit gains over the last 24 hours. Technically, NEAR extends the breakout of the falling channel pattern, VIRTUAL holds above the 50-day EMA, while MORPHO tests a crucial resistance. 

The market is not panicking it is repricing the probability distribution of Oil and time

At the end of the day, markets do not trade morality or geopolitics. They trade transmission channels. And the only channel that truly matters in this maelstrom runs through the price of energy and the time value of money.

Grass 20% bullish breakout defies broader market weakness

Grass (GRASS) is edging up above $0.30 at the time of writing on Monday. The token’s notable 20% intraday surge stands out amid heightened volatility in the broader crypto market.