|

EUR/USD Price Analysis: Bulls push higher but overbought signals hint at correction

  • EUR/USD holds gains after the European session, trading near the 1.0870 area and marking fresh highs since November 2024.
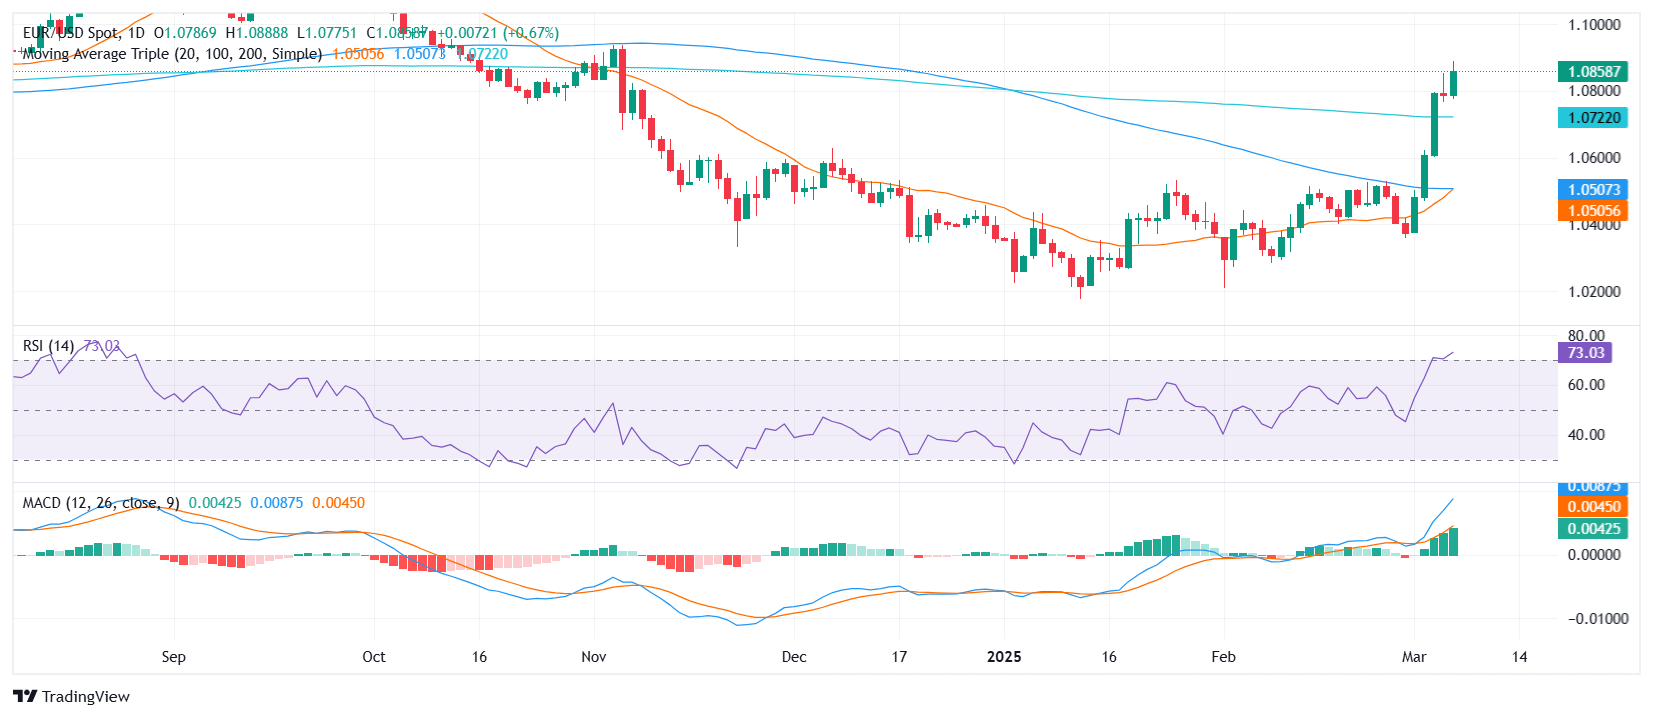
  • The 20 and 100-day moving averages are nearing a bullish crossover, while overbought RSI suggests a possible correction.
  • Immediate resistance is seen near 1.0900 while key support lies at 1.0800.

The EUR/USD pair stands higher on Friday after the European session, reaching its strongest level since November 2024 above 1.0800 as bullish momentum continued to build. Buyers remain firmly in control, driving the pair into fresh territory, with price action now reflecting strong upward momentum.

The Relative Strength Index (RSI) is positioned in overbought territory and rising sharply, indicating strong buying pressure but also signaling that the rally could face exhaustion soon. Meanwhile, the Moving Average Convergence Divergence (MACD) is printing rising green bars, reinforcing the current bullish outlook. A notable development is the approaching bullish crossover between the 20-day and 100-day Simple Moving Averages (SMAs), which could further support buyers if confirmed.

On the technical front, resistance is now seen near the 1.0900 zone, with a break above potentially opening the door for further gains toward 1.0950. On the downside, immediate support stands around 1.0800, followed by 1.0700 and well below the 20 and 100-day SMA convergence near 1.0500. If selling pressure emerges, a pullback toward these levels could signal a technical correction before another bullish attempt.

EUR/USD daily chart

Author

Patricio Martín

Patricio is an economist from Argentina passionate about global finance and understanding the daily movements of the markets.

More from Patricio Martín
Share:

Editor's Picks

AUD/USD eyes 0.7150 barrier nine-day EMA

AUD/USD inches higher after registering modest losses in the previous day, trading around 0.7130 during the Asian hours. The technical analysis of the daily chart indicates that the pair is moving sideways within the rectangle pattern, suggesting a consolidation as neither the bulls nor the bears have enough momentum to take control of the market.

USD/JPY trades below 160.00 intervention threshold; bullish bias intact

The USD/JPY pair attracts some sellers during the Asian session amid fears that authorities will step in again to prop up the Japanese Yen. Furthermore, the Israel-Lebanon truce prompts some profit-taking around the US Dollar and exerts downward pressure on the currency pair.

Gold defends 200-day SMA at $4,425, but for how long?

Gold is attempting a tepid recovery toward $4,500 early Thursday, as renewed optimism in the Mideast geopolitical front calms market nerves. This cautious optimism across Asian markets weighs on Oil prices, and diminishes the US Dollar’s safe-haven appeal, helping Gold stage a decent comeback from the weekly low of $4,424.


Hyperliquid: ETF demand, capital rotation fuel HYPE rally as Bitcoin melts

Hyperliquid price sustains an upward trend near its all-time high of $75.76 on Thursday after posting 80% gains in May, while Bitcoin (BTC) retraces below $65,000, triggering a market-wide panic.

Kevin Warsh takes the Fed helm: What it means for the US Dollar
The Federal Reserve moves away from the highly predictable "forward guidance" model of the Jerome Powell era to a new “Kevin Warsh environment”, characterized by less communication, more policy surprises, and an increased focus on the Fed's complex balance sheet.
Recession on paper: What really moves the Canadian Loonie now?

Statistics Canada handed the headline writers a gift and the analysts a headache. Real GDP shrank 0.1% on an annualized basis in the first quarter, and with the fourth quarter of 2025 revised down to a 1.0% contraction, that is two negative quarters in a row, the textbook definition of a technical recession and Canada's first since the pandemic.