|

EUR/USD Price Analysis: Bulls approach critical resistance near 100-day SMA

  • EUR/USD posts moderate gains, nearing a key resistance zone.
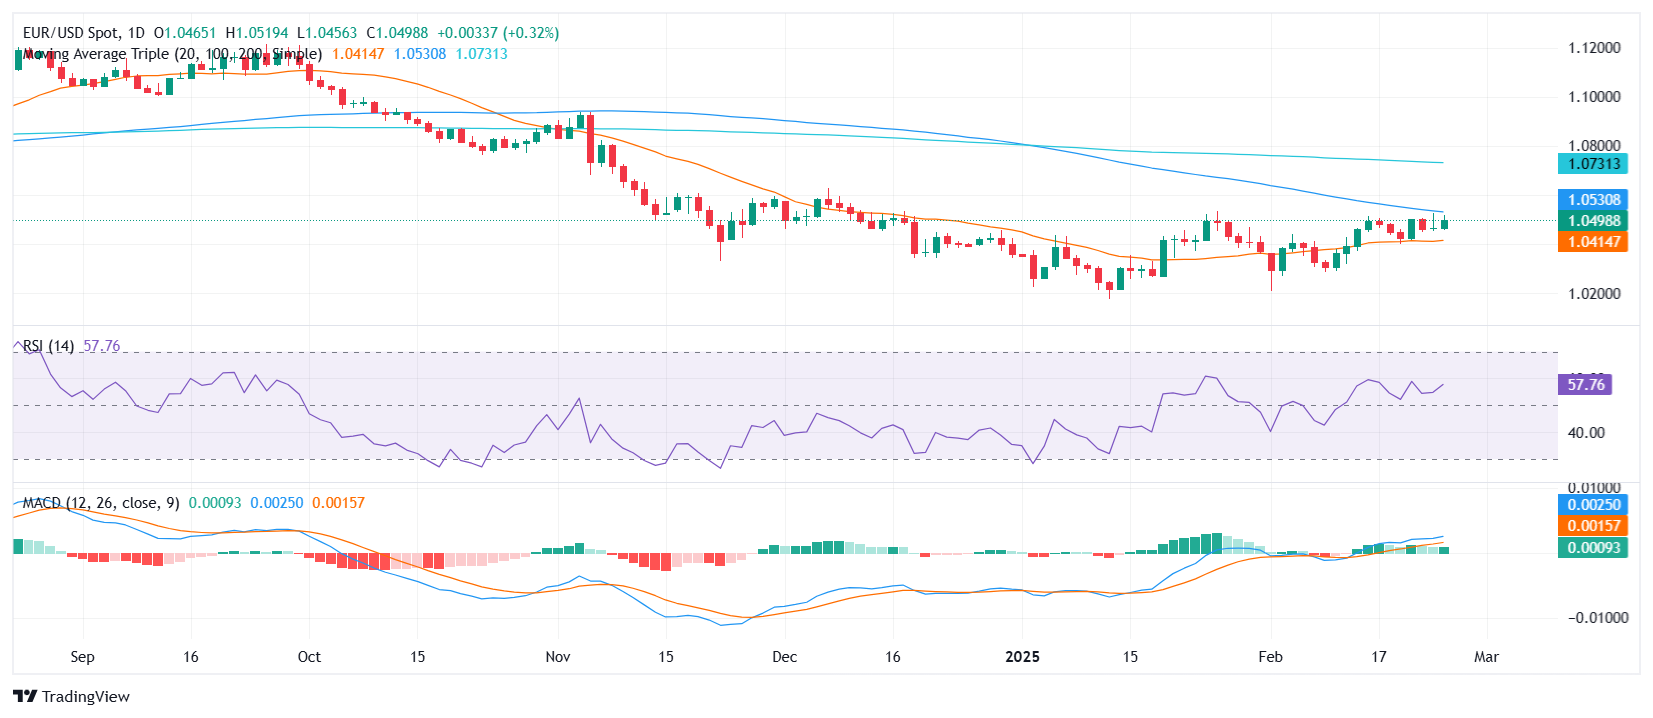
  • RSI climbs in positive territory, signaling to strengthen bullish momentum.
  • Bulls appear poised for another retest of the 100-day SMA after failing to break through.

The EUR/USD pair extended its upward momentum on Tuesday, inching closer to the crucial 100-day Simple Moving Average (SMA). After a solid advance in recent sessions, the pair now finds itself testing familiar resistance levels. Although buyers haven’t yet conquered this barrier, recent price action suggests that bulls may be gearing up for another attempt.

Technical indicators highlight growing bullish momentum. The Relative Strength Index (RSI) has advanced deeper into positive territory, suggesting that buying interest remains firm. Meanwhile, the Moving Average Convergence Divergence (MACD) histogram prints flat green bars, reflecting a pause in momentum but hinting at a potential bullish continuation if resistance breaks.

In the near term, a decisive break above the 100-day SMA could open the door for further gains, with the next resistance potentially around the 1.0550 region. However, if the pair faces another rejection at this level, the bullish narrative may begin to fade, possibly sending the pair back toward support around the 20-day SMA. The next few sessions will be crucial to determine whether buyers can maintain their hold or if the bears will regain control.

EUR/USD daily chart

Author

Patricio Martín

Patricio is an economist from Argentina passionate about global finance and understanding the daily movements of the markets.

More from Patricio Martín
Share:

Editor's Picks

EUR/USD eyes nine-day EMA barrier after rebounding from 1.1600

EUR/USD gains ground after registering modest losses in the previous session, trading around 1.1620 during the Asian hours on Friday. The technical analysis of the daily chart suggests an ongoing bearish bias as the pair remains within the descending channel pattern.

GBP/USD: Pound Sterling ticks up against US Dollar in countdown to US NFP

The Pound Sterling trades marginally higher to near 1.3365 against the US Dollar during the Asian trading session on Friday. The GBP/USD pair edges up as the US Dollar ticks down ahead of the United States Nonfarm Payrolls data for February, which will be published at 13:30 GMT.

Gold awaits US Nonfarm Payrolls for a clear directional impetus

Gold rebounds above $5,100 early Friday after testing the $5,050 level amid global sell-off. The US Dollar pulls back as profit-taking creeps in ahead of US labor data. For February. 21-day SMA holds amid bullish RSI; a daily closing above 61.8% Fibo is critical for Gold buyers.

Ethereum pull in $169M as validators pile in to stake ETH

US spot Ethereum exchange-traded funds recorded $169 million in net inflows on Wednesday, marking the largest daily intake in two months, according to SoSoValue data. The rise in inflows signals renewed institutional interest in Ethereum amid broader market volatility.

The market compass is pointing at a barrel of Oil

The Asian open is arriving with equities leaning the wrong way, and the reason is not complicated. The market’s compass needle has snapped firmly toward crude. In this tape, oil is not just another input price; it is the gravitational center around which every asset class is orbiting.

Ripple tests recovery strength amid steady ETF inflows, growing retail interest

Ripple (XRP) continues to demonstrate notable resilience as the cryptocurrency market navigates the persistent war in the Middle East after the United States (US) and Israel attacked Iran on Saturday.