|

EUR/JPY Technical Analysis: Euro climbs above the 120.00 handle against yen

  • EUR/JPY has been slowly grinding up since the start of the week. 
  • Resistance is seen at the 120.45/63 price zone.
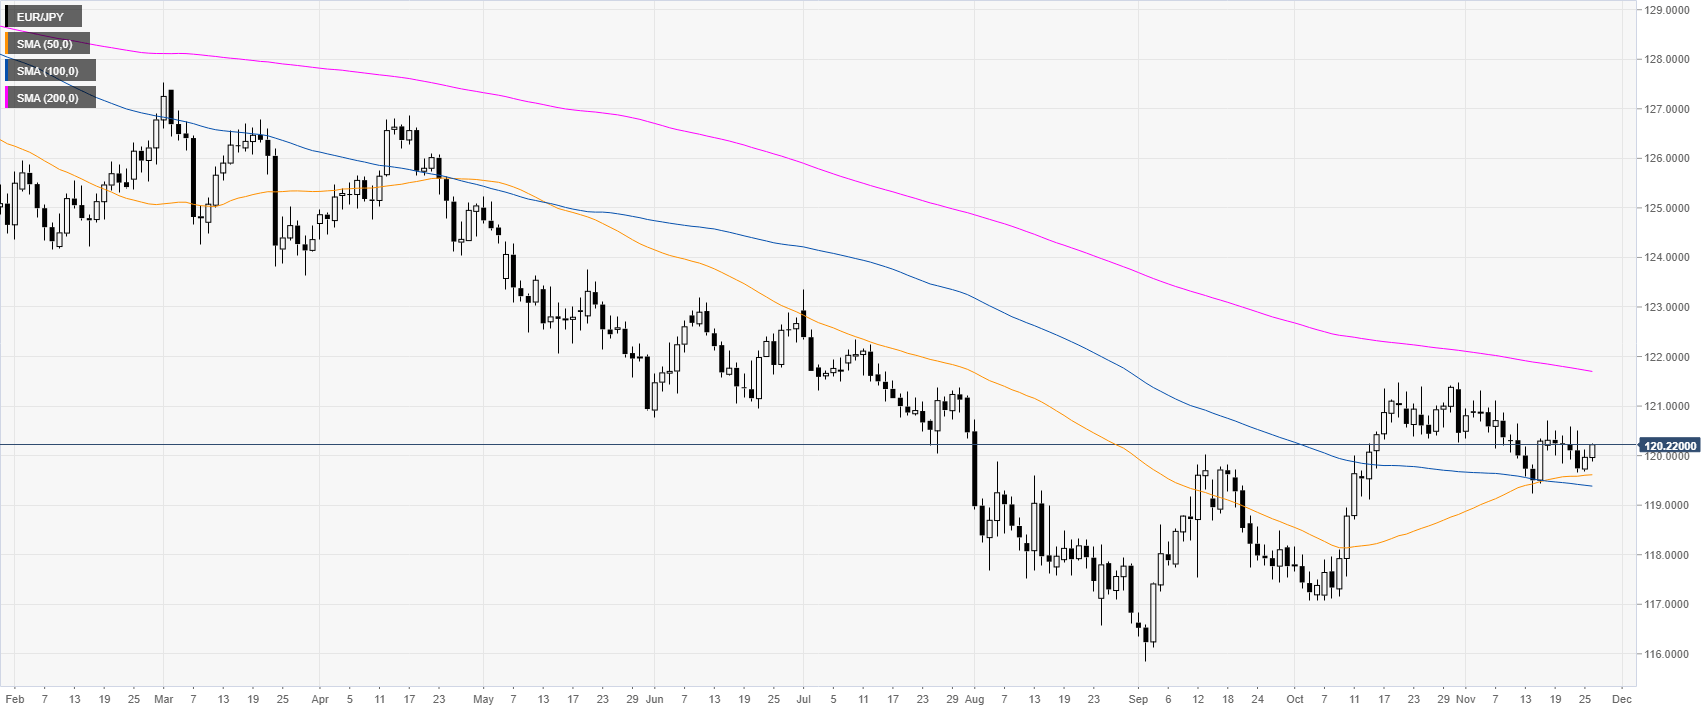
 

EUR/JPY daily chart

 
EUR/JPY is trading in a downtrend below the 200-day simple moving average (DMA). The market is currently consolidating the October bull run as the market stays capped by the 121.00 handle.
 

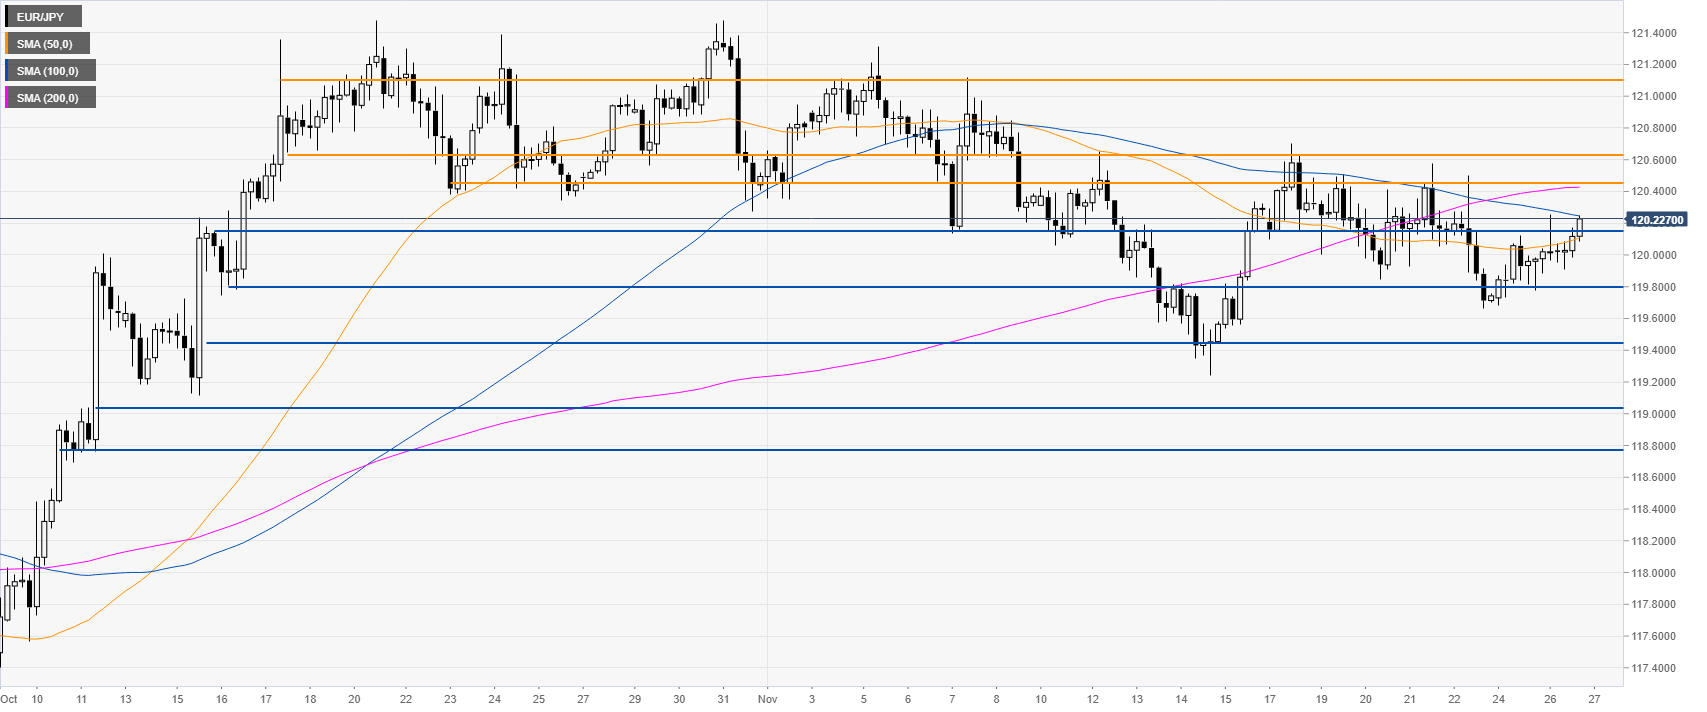
EUR/JPY four-hour chart

 
The market is grinding up above the 120.00 while challenging the 100 SMA. If the spot holds above 120.15, the current move can extend to the 120.45/63 resistance zone near the 200 SMA, according to Technical Confluences Indicator


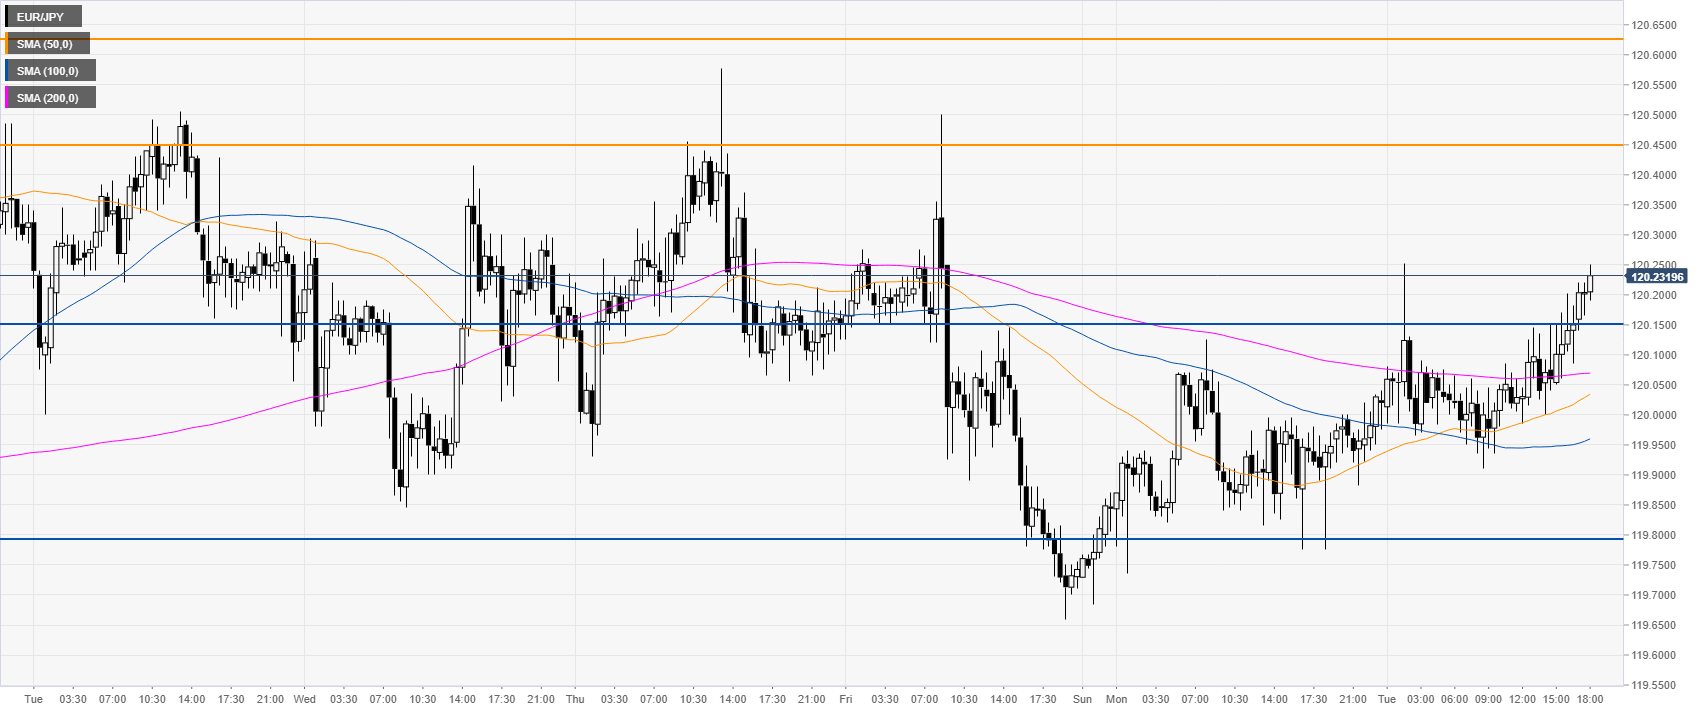
EUR/JPY 30-minute chart

 
The cross is advancing above its main SMAs, suggesting a bullish bias in the near term. Support is seen at the 120.15 and 119.80 price levels, according to Technical Confluences Indicator.
 

Additional key levels

EUR/JPY

Overview
Today last price120.22
Today Daily Change0.25
Today Daily Change %0.21
Today daily open119.97
 
Trends
Daily SMA20120.37
Daily SMA50119.6
Daily SMA100119.4
Daily SMA200121.72
 
Levels
Previous Daily High120.12
Previous Daily Low119.68
Previous Weekly High120.7
Previous Weekly Low119.66
Previous Monthly High121.48
Previous Monthly Low117.07
Daily Fibonacci 38.2%119.96
Daily Fibonacci 61.8%119.85
Daily Pivot Point S1119.72
Daily Pivot Point S2119.48
Daily Pivot Point S3119.28
Daily Pivot Point R1120.17
Daily Pivot Point R2120.37
Daily Pivot Point R3120.61

Author

Flavio Tosti

Flavio Tosti

Independent Analyst


More from Flavio Tosti
Share:

Editor's Picks

EUR/USD: US Dollar comeback in the makes?

The US Dollar stands victorious at the end of another week, with the EUR/USD pair trading near a four-week low of 1.1742, while the USD retains its strength despite some discouraging American data released at the end of the week. The pair edged higher on Friday, after the United States Supreme Court ruled against President Donald Trump's tariffs, although the advance is not enough to change the latest USD flow.

GBP/USD braces for more pain, as 200-day SMA tested

GBP/USD broke the previous week’s consolidation to the downside, as sellers returned with pomp, smashing the major back toward the levels last seen in late January. The pair tested bids below the 1.3450 barrier as the US Dollar strength largely played out throughout the week, while the Pound Sterling stepped back on expectations of divergent monetary policy outlooks between the Bank of England and the US Federal Reserve.

Gold rises to near $5,100 as Trump’s tariffs boost haven demand, US-Iran talks eyed

Gold price edges higher to near $5,095 during the early Asian session on Monday. The precious metal extends the rally amid US President Donald Trump’s tariff threats and uncertainty, boosting safe-haven flows. 

Week ahead: Markets brace for heightened volatility as event risk dominates

Dollar strength dominates markets as risk appetite remains subdued. A Supreme Court ruling, geopolitics and Fed developments are in focus. Pivotal Nvidia earnings on Wednesday as investors question tech sector weakness. Yen and aussie diverge; both pound and euro could recoup their losses.

Broadening drivers of growth: Unpacking GDP and looking ahead

This week’s data delivered a familiar theme with an important twist. The U.S. economy continues to be shaped by powerful forces in high-tech and AI-related investment, but recent releases suggest the growth story may finally be broadening. At the same time, trade flows are moving in a less supportive direction, reminding us that not all parts of the economy are pulling in sync.

Ripple bulls defend key support amid waning retail demand and ETF inflows

XRP ticks up above $1.40 support, but waning retail demand suggests caution. XRP attracts $4 million in spot ETF inflows on Thursday, signaling renewed institutional investor interest.