EUR/JPY Price Forecast: Trades around 169.50 after retreating from twelve-month highs
- EUR/JPY may rebound toward the 12-month high at 169.86, marked on Monday.
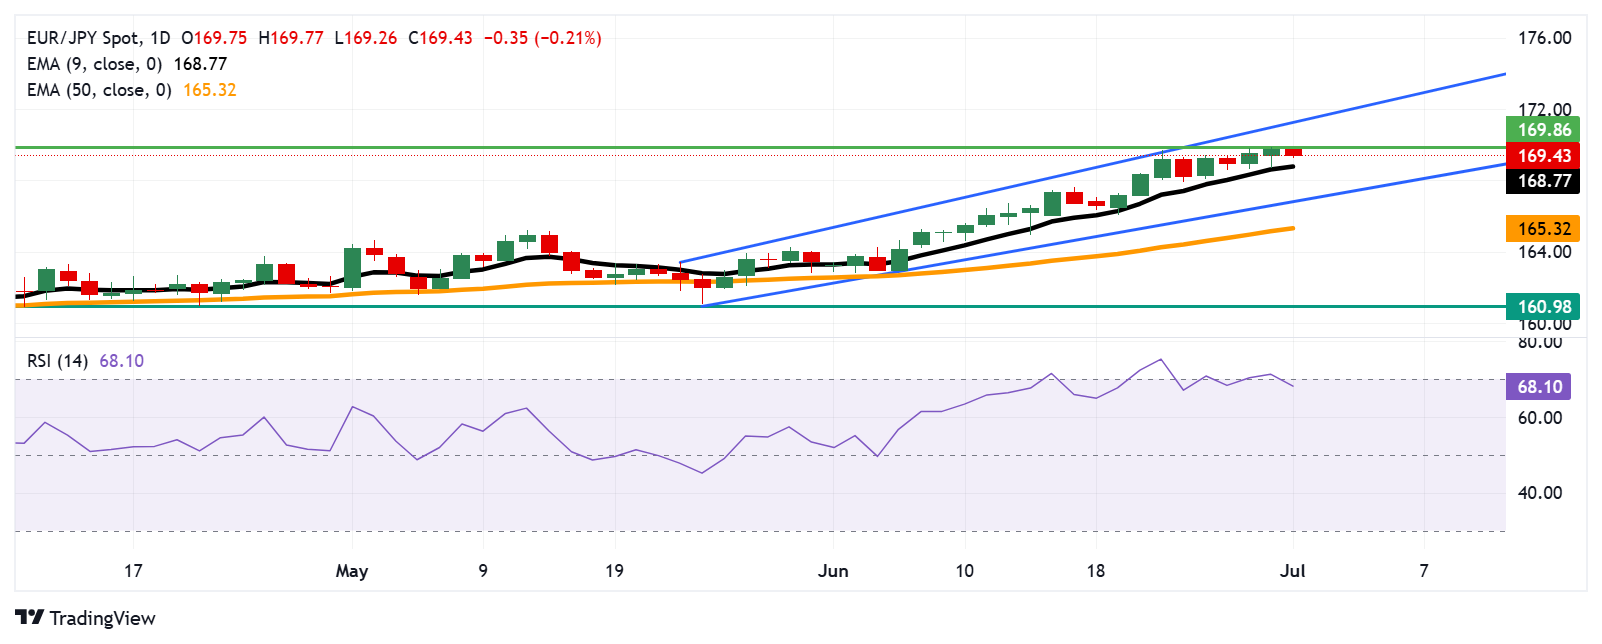
- The 14-day RSI hovers just below 70, indicating the persistent bullish bias.
- The nine-day EMA of 168.77 would act as the primary support.

EUR/JPY depreciates after two days of gains, trading around 169.40 during the Asian hours on Tuesday. The technical analysis of the daily chart shows that the currency cross moves upwards within the ascending channel pattern, strengthening the bullish bias.
The 14-day Relative Strength Index (RSI) is positioned slightly below the 70 mark, strengthening the bullish sentiment. However, if the RSI breaks above the 70 mark, the pair would be in an overbought zone and indicate a downward correction soon. Additionally, the short-term price momentum is stronger as the EUR/JPY cross remains above the nine-day Exponential Moving Average (EMA).
On the upside, the EUR/JPY cross may test the 12-month high at 169.86, which was recorded on June 30. A successful breach above this level would reinforce the market bias and support the currency cross to test the upper boundary of the ascending channel around 171.40.
The initial support appears at the nine-day EMA of 168.77. Further declines would weaken the short-term price momentum and put downward pressure on the EUR/JPY cross to fall toward the ascending channel’s lower boundary around 167.00, followed by the 50-day EMA at 165.32.
A break below the 50-day EMA would dampen the medium-term price momentum and prompt the pair to navigate the region around the “throwback resistance” at 161.00
EUR/JPY: Daily Chart
Euro PRICE Today
The table below shows the percentage change of Euro (EUR) against listed major currencies today. Euro was the weakest against the Japanese Yen.
| USD | EUR | GBP | JPY | CAD | AUD | NZD | CHF | |
|---|---|---|---|---|---|---|---|---|
| USD | -0.04% | -0.09% | -0.27% | 0.01% | 0.11% | 0.06% | -0.13% | |
| EUR | 0.04% | -0.03% | -0.31% | 0.06% | 0.25% | 0.09% | -0.07% | |
| GBP | 0.09% | 0.03% | -0.14% | 0.12% | 0.28% | 0.14% | -0.03% | |
| JPY | 0.27% | 0.31% | 0.14% | 0.32% | 0.36% | 0.30% | 0.14% | |
| CAD | -0.01% | -0.06% | -0.12% | -0.32% | 0.08% | 0.01% | -0.16% | |
| AUD | -0.11% | -0.25% | -0.28% | -0.36% | -0.08% | -0.15% | -0.32% | |
| NZD | -0.06% | -0.09% | -0.14% | -0.30% | -0.01% | 0.15% | -0.18% | |
| CHF | 0.13% | 0.07% | 0.03% | -0.14% | 0.16% | 0.32% | 0.18% |
The heat map shows percentage changes of major currencies against each other. The base currency is picked from the left column, while the quote currency is picked from the top row. For example, if you pick the Euro from the left column and move along the horizontal line to the US Dollar, the percentage change displayed in the box will represent EUR (base)/USD (quote).
Author

Akhtar Faruqui
FXStreet
Akhtar Faruqui is a Forex Analyst based in New Delhi, India. With a keen eye for market trends and a passion for dissecting complex financial dynamics, he is dedicated to delivering accurate and insightful Forex news and analysis.