EUR/JPY Price Forecast: Maintains position above 171.50, targets fresh one-year highs
- EUR/JPY may retest the new yearly high at 172.28, marked on Wednesday.
- The 14-day RSI remains above 70, indicating an overbought zone and a potential downward correction.
- The nine-day EMA of 170.67 would act as the primary support.

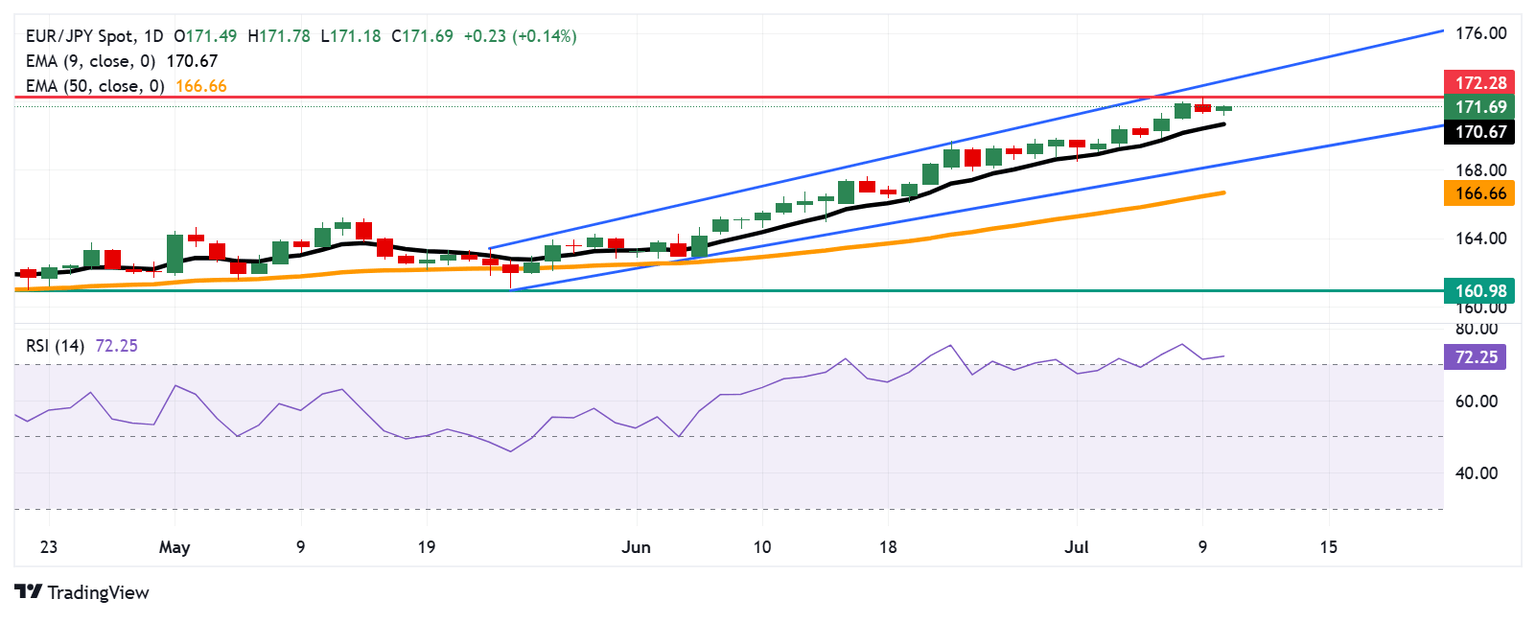
EUR/JPY edges higher after registering losses in the previous session, trading around 171.60 during the European hours on Thursday. The bullish bias is strengthening as the technical analysis of the daily chart shows that the currency cross moves upwards within the ascending channel pattern.
The short-term price momentum is stronger as the EUR/JPY cross remains above the nine-day Exponential Moving Average (EMA). However, the 14-day Relative Strength Index (RSI) is remaining slightly above the 70 mark, suggesting a potential downward correction as the EUR/JPY cross is positioned in an overbought zone.
On the upside, the EUR/JPY cross may test the fresh yearly high at 172.28, which was recorded on July 10. A successful breach above this level would strengthen the bullish bias and support the currency cross to approach the upper boundary of the ascending channel around 172.30.
The primary support appears at the nine-day EMA of 170.67. A break below this level could weaken the short-term price momentum and put downward pressure on the EUR/JPY cross to navigate the region around the ascending channel’s lower boundary around 168.50, followed by the 50-day EMA at 166.66.
EUR/JPY: Daily Chart
Euro PRICE Today
The table below shows the percentage change of Euro (EUR) against listed major currencies today. Euro was the strongest against the Swiss Franc.
| USD | EUR | GBP | JPY | CAD | AUD | NZD | CHF | |
|---|---|---|---|---|---|---|---|---|
| USD | -0.06% | -0.14% | 0.04% | -0.08% | -0.33% | -0.18% | 0.08% | |
| EUR | 0.06% | -0.09% | 0.09% | -0.01% | -0.25% | -0.13% | 0.12% | |
| GBP | 0.14% | 0.09% | 0.16% | 0.08% | -0.16% | -0.02% | 0.21% | |
| JPY | -0.04% | -0.09% | -0.16% | -0.11% | -0.35% | -0.15% | -0.06% | |
| CAD | 0.08% | 0.00% | -0.08% | 0.11% | -0.21% | -0.13% | 0.13% | |
| AUD | 0.33% | 0.25% | 0.16% | 0.35% | 0.21% | 0.10% | 0.33% | |
| NZD | 0.18% | 0.13% | 0.02% | 0.15% | 0.13% | -0.10% | 0.25% | |
| CHF | -0.08% | -0.12% | -0.21% | 0.06% | -0.13% | -0.33% | -0.25% |
The heat map shows percentage changes of major currencies against each other. The base currency is picked from the left column, while the quote currency is picked from the top row. For example, if you pick the Euro from the left column and move along the horizontal line to the US Dollar, the percentage change displayed in the box will represent EUR (base)/USD (quote).
Author

Akhtar Faruqui
FXStreet
Akhtar Faruqui is a Forex Analyst based in New Delhi, India. With a keen eye for market trends and a passion for dissecting complex financial dynamics, he is dedicated to delivering accurate and insightful Forex news and analysis.


