EUR/JPY Price Forecast: Holds near 176.00, all-time highs due to bullish bias
- EUR/JPY stays close to fresh all-time high of 176.35 reached on Tuesday.
- The 14-day Relative Strength Index remains near 70, strengthening the bullish bias.
- The initial support lies at the nine-day EMA of 174.39.

EUR/JPY edges lower after registering more than 1.5% gains in the previous session, trading around 176.00 during the European hours on Tuesday. The technical analysis of the daily chart indicates strengthening of a bullish bias as the currency cross remains above the ascending channel pattern.
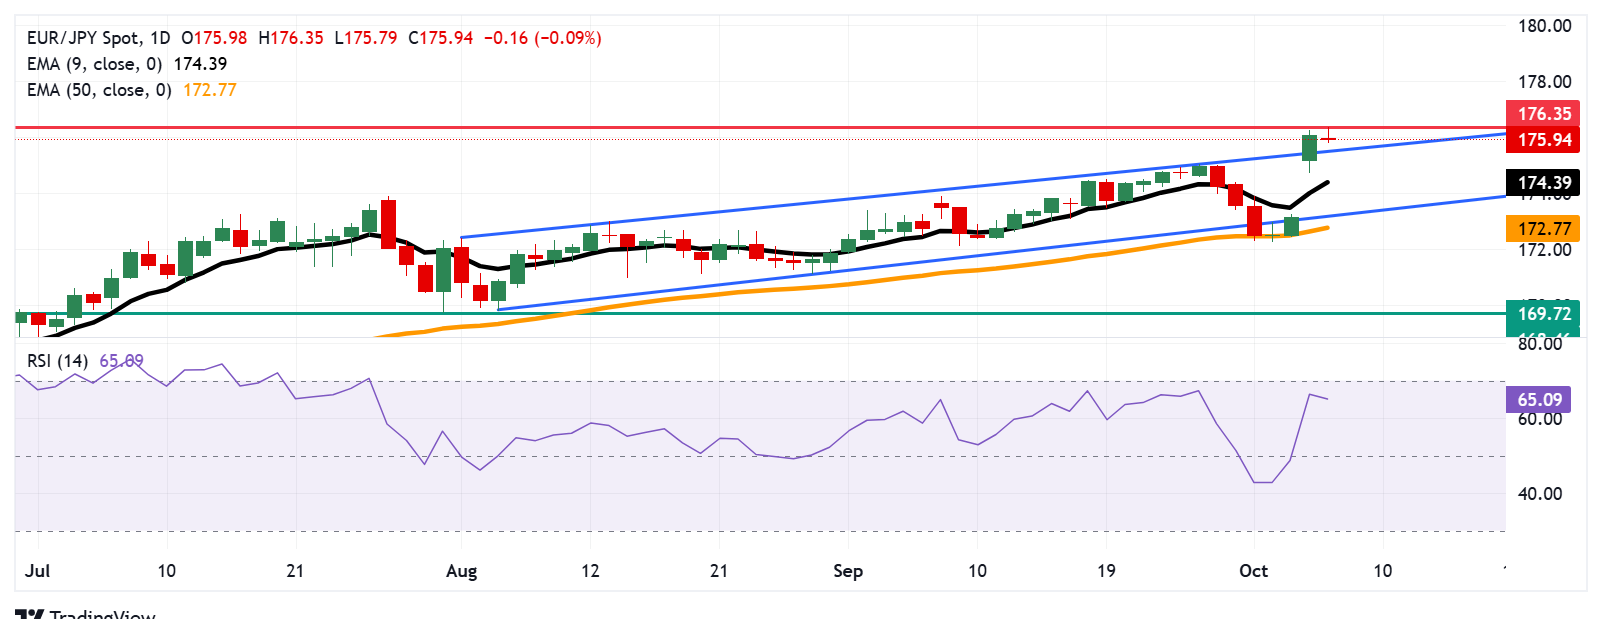
The 14-day Relative Strength Index (RSI) remains slightly below 70 mark, suggesting that bullish bias is strengthening. A break above the 70 mark would suggest an overbought situation and a downward correction anytime soon. Additionally, the short-term price momentum is stronger as the EUR/JPY cross is positioned above the nine-day Exponential Moving Average (EMA).
On the upside, the EUR/JPY cross may target the new all-time high of 176.35, which was recorded on October 7. As the market bias is bullish, the cross may explore the region around the psychological level of 177.00.
A return within the ascending channel would prompt the EUR/JPY cross to test the nine-day EMA at 174.39. Further declines below the level would dampen the short-term price momentum and put downward pressure on the currency cross to approach the lower boundary of the channel around 173.20, followed by the 50-day EMA at 172.77.
A drop below the 50-day EMA would signal weakening medium-term momentum and could drive the EUR/JPY pair lower toward the three-month low of 169.72, last seen on July 31.
EUR/JPY: Daily Chart
Euro Price Today
The table below shows the percentage change of Euro (EUR) against listed major currencies today. Euro was the strongest against the New Zealand Dollar.
| USD | EUR | GBP | JPY | CAD | AUD | NZD | CHF | |
|---|---|---|---|---|---|---|---|---|
| USD | 0.40% | 0.34% | 0.32% | 0.09% | 0.35% | 0.59% | 0.22% | |
| EUR | -0.40% | -0.05% | -0.07% | -0.30% | -0.03% | 0.20% | -0.06% | |
| GBP | -0.34% | 0.05% | -0.02% | -0.25% | 0.07% | 0.22% | -0.00% | |
| JPY | -0.32% | 0.07% | 0.02% | -0.20% | 0.08% | 0.19% | -0.12% | |
| CAD | -0.09% | 0.30% | 0.25% | 0.20% | 0.25% | 0.46% | 0.25% | |
| AUD | -0.35% | 0.03% | -0.07% | -0.08% | -0.25% | 0.08% | -0.08% | |
| NZD | -0.59% | -0.20% | -0.22% | -0.19% | -0.46% | -0.08% | -0.30% | |
| CHF | -0.22% | 0.06% | 0.00% | 0.12% | -0.25% | 0.08% | 0.30% |
The heat map shows percentage changes of major currencies against each other. The base currency is picked from the left column, while the quote currency is picked from the top row. For example, if you pick the Euro from the left column and move along the horizontal line to the US Dollar, the percentage change displayed in the box will represent EUR (base)/USD (quote).
Author

Akhtar Faruqui
FXStreet
Akhtar Faruqui is a Forex Analyst based in New Delhi, India. With a keen eye for market trends and a passion for dissecting complex financial dynamics, he is dedicated to delivering accurate and insightful Forex news and analysis.


