• EUR/JPY stages a comeback and hits a three-day new high at 141.97, shy of the 142.00 mark.
  • EUR/JPY Price Analysis: Sideways awaiting a catalyst to gather direction.

The Euro (EUR) is recovering some ground against the Japanese Yen (JPY), as the Wall Street close looms, after hitting two-week lows of 140.55, though it staged a comeback and traveled back to the day’s high at 141.97. At the time of writing, the EUR/JPY exchanges hands at 141.50, above its opening price.

EUR/JPY Price Analysis: Technical outlook

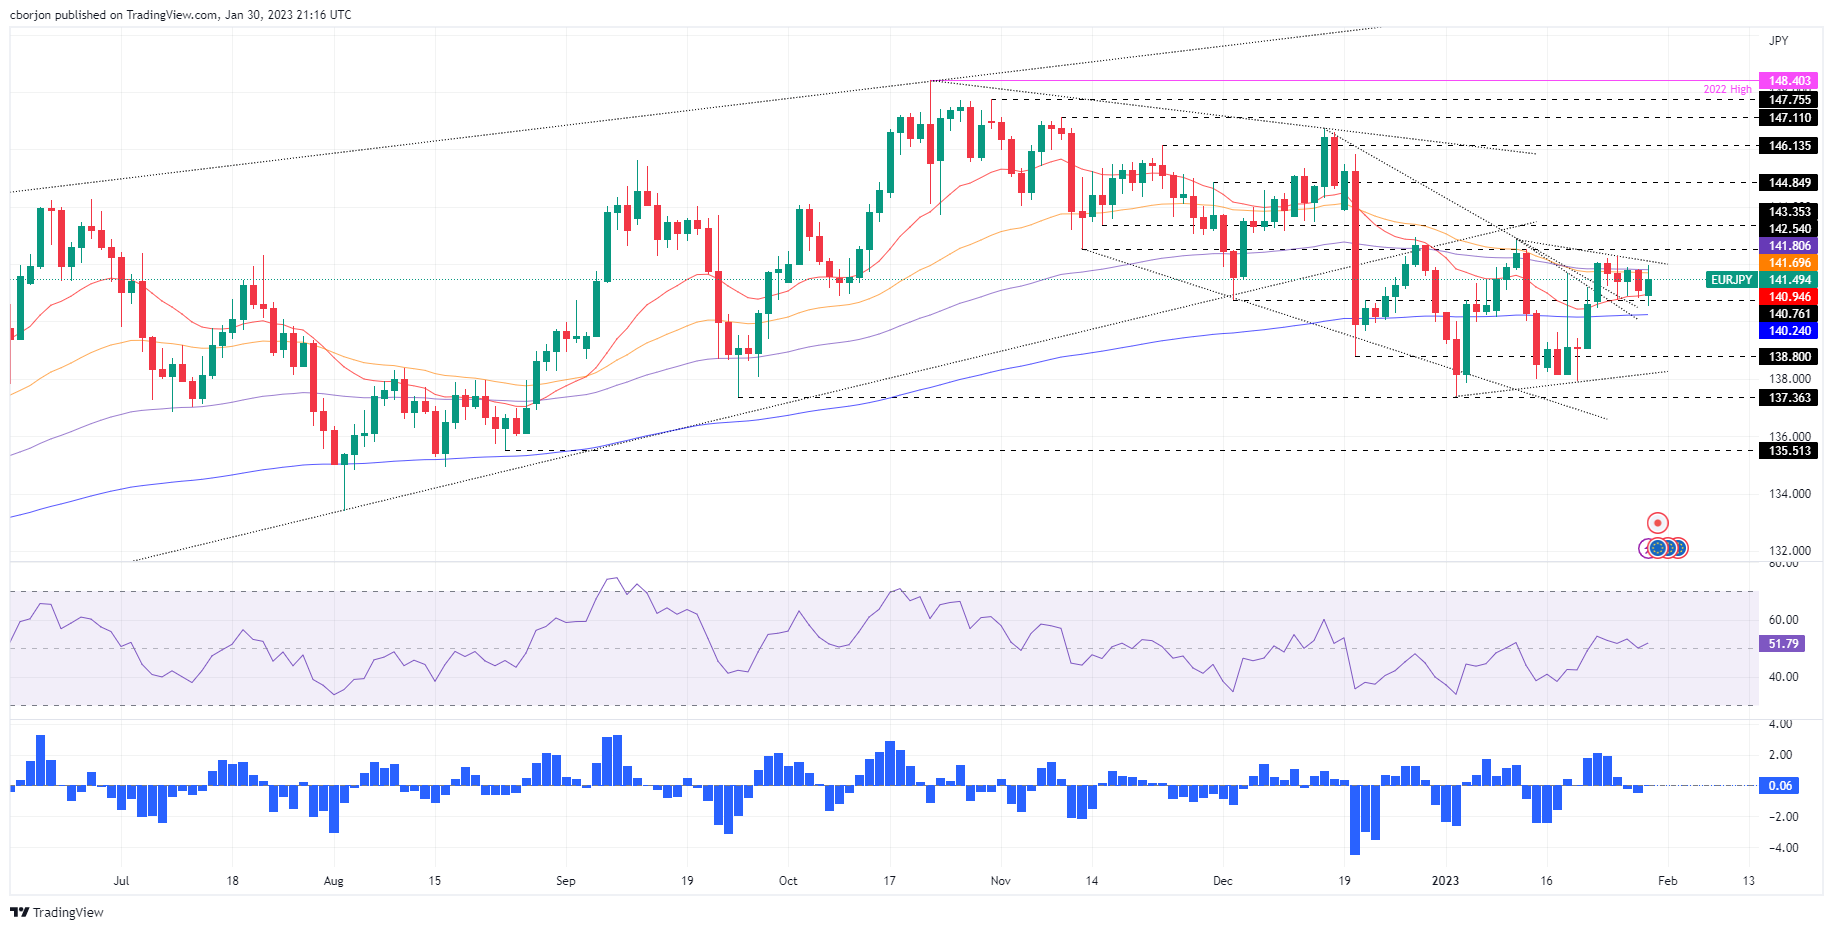
After rallying from the January 19 daily low of 137.91 towards the January 25 daily high of 142.29, the USD/JPY remains trapped in a 250 pip range within the 140.75-142.39 range for the last five days. Furthermore, the 20-day Exponential Moving Average (EMA) at 140.94 and the 50-day EMA at 141.70 acted as the support/resistance of the range. Therefore, the EUR/JPY is trendless amid the lack of a catalyst.

Oscillator-wise, the Relative Strength Index (RSI) at bullish territory backed today’s price action, contrary to the Rate of Change (RoC), which indicates sellers are beginning to gather momentum.

Therefore, the EUR/JPY first resistance would be the 50-day EMA at 141.70 and might rally once broken. The next resistance would be the 142.00 psychological level, ahead of the Wednesday 25 high at 142.29, followed by the 143.00 figure.

In an alternate scenario, if the USD/JPY pair breaks downwards, it would expose key support levels. First, the 20-day EMA at 140.94, followed by the 200-day EMA at 140.24, and then the psychological 140.00 mark.

EUR/JPY Price Analysis

EUR/JPY

Overview
Today last price 141.49
Today Daily Change 0.37
Today Daily Change % 0.26
Today daily open 141.12
 
Trends
Daily SMA20 140.42
Daily SMA50 142.13
Daily SMA100 143.1
Daily SMA200 140.86
 
Levels
Previous Daily High 141.92
Previous Daily Low 140.82
Previous Weekly High 142.3
Previous Weekly Low 140.47
Previous Monthly High 146.73
Previous Monthly Low 138.8
Daily Fibonacci 38.2% 141.24
Daily Fibonacci 61.8% 141.5
Daily Pivot Point S1 140.65
Daily Pivot Point S2 140.19
Daily Pivot Point S3 139.56
Daily Pivot Point R1 141.75
Daily Pivot Point R2 142.38
Daily Pivot Point R3 142.85


Share: Feed news

Information on these pages contains forward-looking statements that involve risks and uncertainties. Markets and instruments profiled on this page are for informational purposes only and should not in any way come across as a recommendation to buy or sell in these assets. You should do your own thorough research before making any investment decisions. FXStreet does not in any way guarantee that this information is free from mistakes, errors, or material misstatements. It also does not guarantee that this information is of a timely nature. Investing in Open Markets involves a great deal of risk, including the loss of all or a portion of your investment, as well as emotional distress. All risks, losses and costs associated with investing, including total loss of principal, are your responsibility. The views and opinions expressed in this article are those of the authors and do not necessarily reflect the official policy or position of FXStreet nor its advertisers. The author will not be held responsible for information that is found at the end of links posted on this page.

If not otherwise explicitly mentioned in the body of the article, at the time of writing, the author has no position in any stock mentioned in this article and no business relationship with any company mentioned. The author has not received compensation for writing this article, other than from FXStreet.

FXStreet and the author do not provide personalized recommendations. The author makes no representations as to the accuracy, completeness, or suitability of this information. FXStreet and the author will not be liable for any errors, omissions or any losses, injuries or damages arising from this information and its display or use. Errors and omissions excepted.

The author and FXStreet are not registered investment advisors and nothing in this article is intended to be investment advice.

Recommended content


Recommended content

Editors’ Picks

AUD/USD remained bid above 0.6500

AUD/USD remained bid above 0.6500

AUD/USD extended further its bullish performance, advancing for the fourth session in a row on Thursday, although a sustainable breakout of the key 200-day SMA at 0.6526 still remain elusive.

AUD/USD News

EUR/USD faces a minor resistance near at 1.0750

EUR/USD faces a minor resistance near at 1.0750

EUR/USD quickly left behind Wednesday’s small downtick and resumed its uptrend north of 1.0700 the figure, always on the back of the persistent sell-off in the US Dollar ahead of key PCE data on Friday.

EUR/USD News

Gold holds around $2,330 after dismal US data

Gold holds around $2,330 after dismal US data

Gold fell below $2,320 in the early American session as US yields shot higher after the data showed a significant increase in the US GDP price deflator in Q1. With safe-haven flows dominating the markets, however, XAU/USD reversed its direction and rose above $2,340.

Gold News

Bitcoin price continues to get rejected from $65K resistance as SEC delays decision on spot BTC ETF options

Bitcoin price continues to get rejected from $65K resistance as SEC delays decision on spot BTC ETF options

Bitcoin (BTC) price has markets in disarray, provoking a broader market crash as it slumped to the $62,000 range on Thursday. Meanwhile, reverberations from spot BTC exchange-traded funds (ETFs) continue to influence the market.

Read more

US economy: slower growth with stronger inflation

US economy: slower growth with stronger inflation

The dollar strengthened, and stocks fell after statistical data from the US. The focus was on the preliminary estimate of GDP for the first quarter. Annualised quarterly growth came in at just 1.6%, down from the 2.5% and 3.4% previously forecast.

Read more

Forex MAJORS

Cryptocurrencies

Signatures