|

EUR/JPY Price Analysis: Seems to peak around 170.00, bears eye further downside

  • EUR/JPY buying pressure fades after consolidating around 168-170 for almost one month.
  • Momentum supports sellers, with potential targets seen at 167.47 and 165.92.
  • Upside is limited, yet a breach of 170.00, could pave the way to test the year-to-date (YTD) high of 171.58.

The EUR/JPY seesawed within a 180-pip range on Thursday yet is posting losses of 0.45% after hitting a daily high of 170.13. At the time of writing, the pair exchanged hands at 168.60, below its opening price.

EUR/JPY Price Analysis: Technical outlook

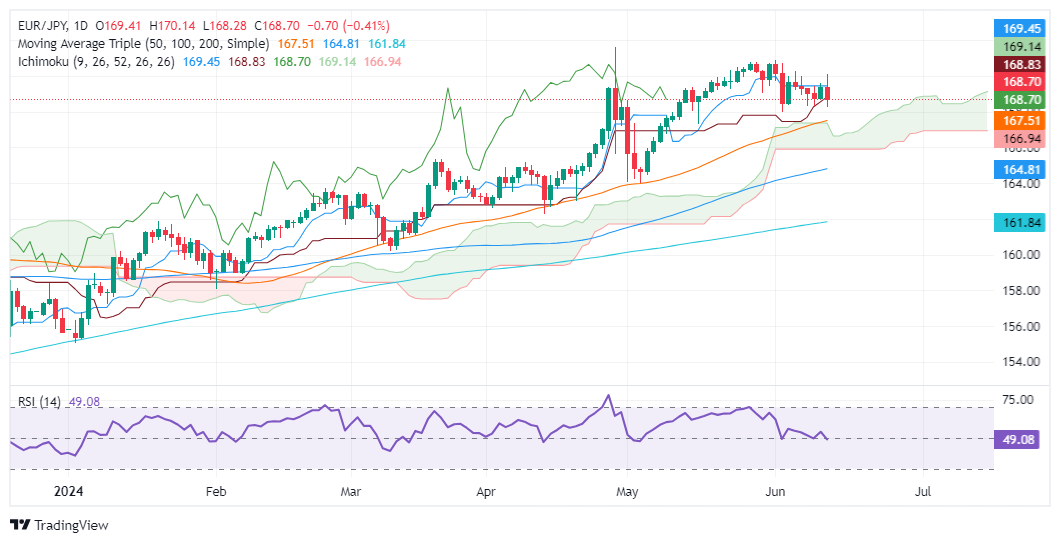
After peaking at around 170.00, the EUR/JPY has consolidated below the latter, yet it cannot drop below the Ichimoku Cloud (Kumo), which would accelerate the downtrend.

The Relative Strength Index (RSI) shows sellers gather momentum after the RSI punches below the 50-line. This suggests the EUR/JPY would be subject to further losses.

If EUR/JPY falls below the 50-day moving average (DMA) of 167.47, that could exacerbate a dip inside the Kumo, an indication of the acceleration of the downtrend. The next support would be the bottom of the Kumo at 165.92, followed by the 100-DMA at 164.78.

EUR/JPY Price Action – Daily Chart

EUR/JPY

Overview
Today last price168.7
Today Daily Change-0.70
Today Daily Change %-0.41
Today daily open169.4
 
Trends
Daily SMA20169.65
Daily SMA50167.42
Daily SMA100164.72
Daily SMA200161.78
 
Levels
Previous Daily High169.59
Previous Daily Low168.66
Previous Weekly High170.89
Previous Weekly Low168.01
Previous Monthly High170.8
Previous Monthly Low164.02
Daily Fibonacci 38.2%169.23
Daily Fibonacci 61.8%169.02
Daily Pivot Point S1168.85
Daily Pivot Point S2168.29
Daily Pivot Point S3167.92
Daily Pivot Point R1169.77
Daily Pivot Point R2170.14
Daily Pivot Point R3170.7

Author

Christian Borjon Valencia

Markets analyst, news editor, and trading instructor with over 14 years of experience across FX, commodities, US equity indices, and global macro markets.

More from Christian Borjon Valencia
Share:

Editor's Picks

EUR/USD seems fragile below 1.1700 as Middle East war boosts energy prices

The EUR/USD pair trades flat at around 1.1680 during the Asian trading session on Tuesday, but broadly seems vulnerable, being close to its five-week low. The major currency pair is under pressure as surging oil prices due to the United States-Israel war with Iran have increased the risks of higher inflation for the Old Continent.

GBP/USD hovers around 1.3400 with bearish pressure intact

GBP/USD edges higher after three days of losses, trading around 1.3400 during the Asian hours on Tuesday. The technical analysis of the daily chart indicates an ongoing bearish bias, as the pair trades within a descending channel pattern.

Gold sticks to gains above $5,350 amid sustained safe-haven demand; firmer USD caps gains

Gold sticks to its positive bias for the third straight day and trades above the $5,350 level heading into the European session on Tuesday. Concerns about a broader regional conflict in the Middle East continue to weigh on investors' sentiment and underpin demand for the traditional safe-haven bullion.

Stellar risks deeper losses as derivatives metrics turn negative

Stellar is trading red below $0.16 at the time of writing on Tuesday, after a slight recovery the previous day. Weakening derivatives data caps the recovery, while an unfavorable technical outlook projects a deeper correction for the XLM token in the upcoming days.

The market is not panicking it is repricing the probability distribution of Oil and time

At the end of the day, markets do not trade morality or geopolitics. They trade transmission channels. And the only channel that truly matters in this maelstrom runs through the price of energy and the time value of money.

Grass 20% bullish breakout defies broader market weakness

Grass (GRASS) is edging up above $0.30 at the time of writing on Monday. The token’s notable 20% intraday surge stands out amid heightened volatility in the broader crypto market.