EUR/JPY Price Analysis: Retreats amid speculation of BoJ hike, technicals signal potential downside


  • EUR/JPY faces a 0.17% decline as Japan's core inflation rise hints at a possible end to negative interest rates.
  • Technical patterns, including a 'bearish harami', suggest further downside, with key levels to watch at 162.56 and 162.00.
  • Recovery above 163.00 could open the path to 164.00, contingent on overcoming resistance near the week's high at 163.72.

The EUR/JPY is dropping late in the North American session, set to register losses of around 0.17% on Tuesday. A rise in core inflation in Japan sparked speculation that the Bank of Japan (BoJ) could increase interest rates, ending the negative interest rate cycle. Therefore, the cross-pair trades at 163.22 after hitting a daily high of 163.52.

EUR/JPY Price Analysis: Technical outlook

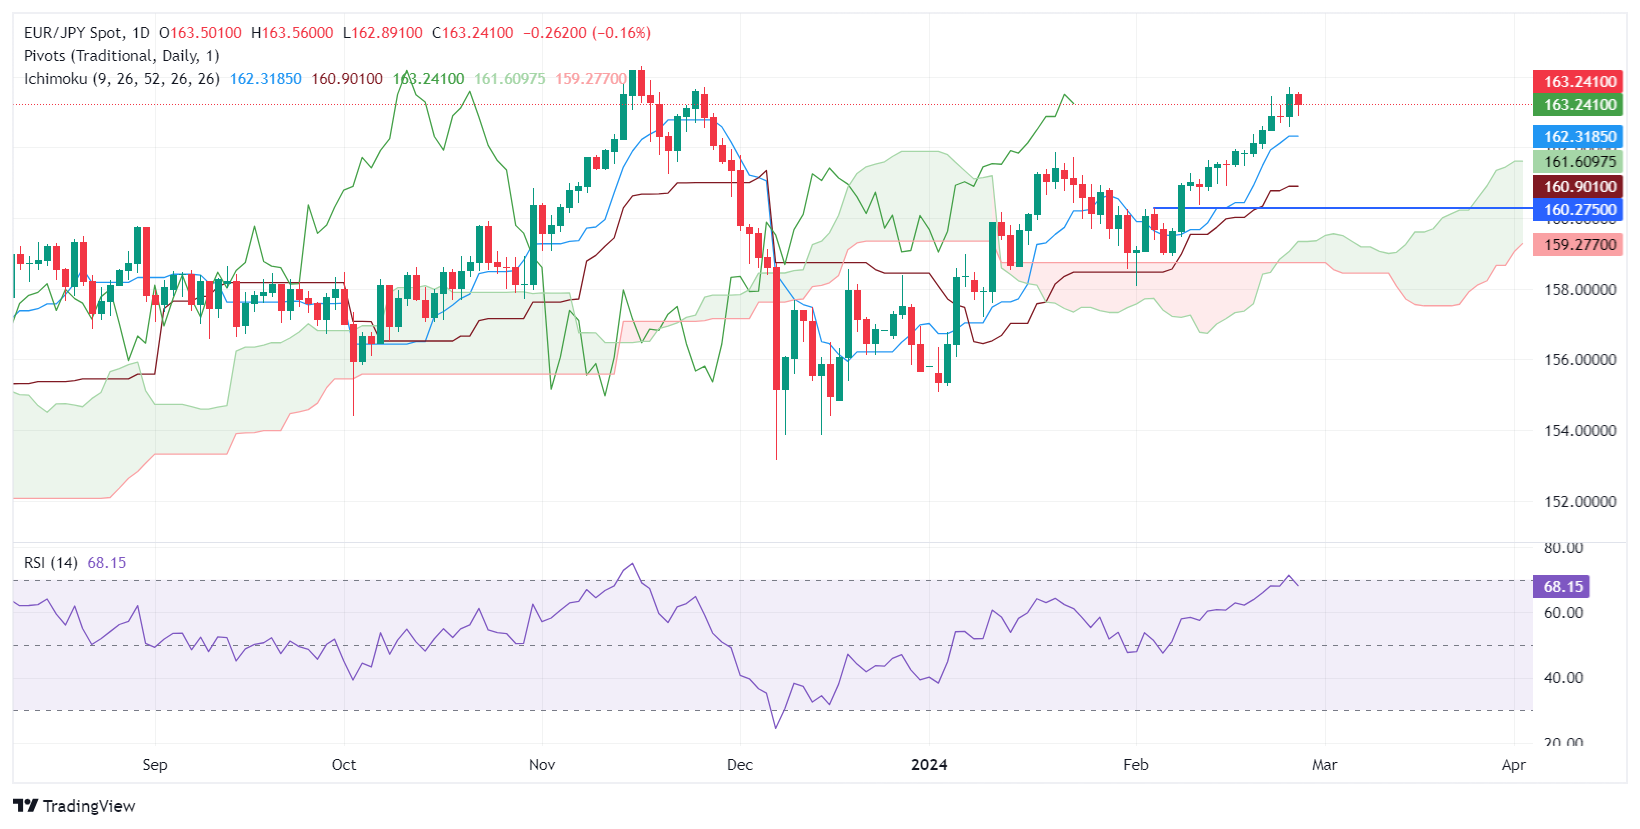
From a technical standpoint, the EUR/JPY failed to extend its rally and edged lower. Nevertheless, price action is well contained within the boundaries of Monday’s price action, which would form a ‘bearish harami’ candlestick chart pattern, suggesting that further downside is expected.

If the EUR/JPY tumbles below 163.00 and decisively breaks below the February 26 low of 162.56, that would exacerbate a test of the 162.00 mark, but on its way south, sellers will face the Tenkan-Sen at 162,31.

Conversely, if buyers keep the exchange rate above 163.00, the EUR/JPY could edge higher above the current week's high at 163.72, which could pave the way for testing the 164.00 mark.

EUR/JPY Price Action – Daily Chart

EUR/JPY

Overview
Today last price 163.21
Today Daily Change -0.29
Today Daily Change % -0.18
Today daily open 163.5
 
Trends
Daily SMA20 161.08
Daily SMA50 159.58
Daily SMA100 159.64
Daily SMA200 157.76
 
Levels
Previous Daily High 163.72
Previous Daily Low 162.56
Previous Weekly High 163.47
Previous Weekly Low 161.48
Previous Monthly High 161.87
Previous Monthly Low 155.07
Daily Fibonacci 38.2% 163.28
Daily Fibonacci 61.8% 163.01
Daily Pivot Point S1 162.8
Daily Pivot Point S2 162.11
Daily Pivot Point S3 161.65
Daily Pivot Point R1 163.96
Daily Pivot Point R2 164.42
Daily Pivot Point R3 165.12


Share: Feed news

Information on these pages contains forward-looking statements that involve risks and uncertainties. Markets and instruments profiled on this page are for informational purposes only and should not in any way come across as a recommendation to buy or sell in these assets. You should do your own thorough research before making any investment decisions. FXStreet does not in any way guarantee that this information is free from mistakes, errors, or material misstatements. It also does not guarantee that this information is of a timely nature. Investing in Open Markets involves a great deal of risk, including the loss of all or a portion of your investment, as well as emotional distress. All risks, losses and costs associated with investing, including total loss of principal, are your responsibility. The views and opinions expressed in this article are those of the authors and do not necessarily reflect the official policy or position of FXStreet nor its advertisers. The author will not be held responsible for information that is found at the end of links posted on this page.

If not otherwise explicitly mentioned in the body of the article, at the time of writing, the author has no position in any stock mentioned in this article and no business relationship with any company mentioned. The author has not received compensation for writing this article, other than from FXStreet.

FXStreet and the author do not provide personalized recommendations. The author makes no representations as to the accuracy, completeness, or suitability of this information. FXStreet and the author will not be liable for any errors, omissions or any losses, injuries or damages arising from this information and its display or use. Errors and omissions excepted.

The author and FXStreet are not registered investment advisors and nothing in this article is intended to be investment advice.

Recommended content


Recommended content

Editors’ Picks

EUR/USD retreats toward 1.0850 on modest USD recovery

EUR/USD retreats toward 1.0850 on modest USD recovery

EUR/USD stays under modest bearish pressure and trades in negative territory at around 1.0850 after closing modestly lower on Thursday. In the absence of macroeconomic data releases, investors will continue to pay close attention to comments from Federal Reserve officials.

EUR/USD News

GBP/USD holds above 1.2650 following earlier decline

GBP/USD holds above 1.2650 following earlier decline

GBP/USD edges higher after falling to a daily low below 1.2650 in the European session on Friday. The US Dollar holds its ground following the selloff seen after April inflation data and makes it difficult for the pair to extend its rebound. Fed policymakers are scheduled to speak later in the day.

GBP/USD News

Gold climbs to multi-week highs above $2,400

Gold climbs to multi-week highs above $2,400

Gold gathered bullish momentum and touched its highest level in nearly a month above $2,400. Although the benchmark 10-year US yield holds steady at around 4.4%, the cautious market stance supports XAU/USD heading into the weekend.

Gold News

Chainlink social dominance hits six-month peak as LINK extends gains

Chainlink social dominance hits six-month peak as LINK extends gains

Chainlink (LINK) social dominance increased sharply on Friday, exceeding levels seen in the past six months, along with the token’s price rally that started on Wednesday. 

Read more

Week ahead: Flash PMIs, UK and Japan CPIs in focus – RBNZ to hold rates

Week ahead: Flash PMIs, UK and Japan CPIs in focus – RBNZ to hold rates

After cool US CPI, attention shifts to UK and Japanese inflation. Flash PMIs will be watched too amid signs of a rebound in Europe. Fed to stay in the spotlight as plethora of speakers, minutes on tap.

Read more

Forex MAJORS

Cryptocurrencies

Signatures