EUR/JPY Price Analysis: Recovers some lost ground above the 157.60 mark, the key contention is seen at 157.20
- EUR/JPY holds above the 157.60 mark but remains below the 50- and 100-hour EMAs.
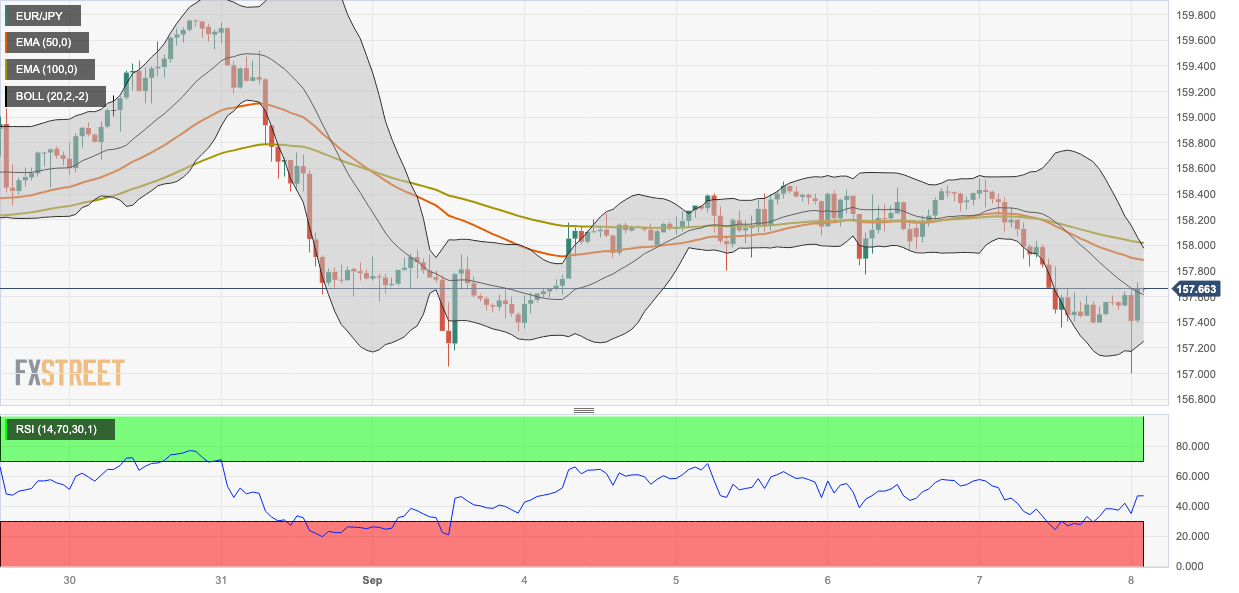
- The Relative Strength Index (RSI) stands below 50, within a bearish territory.
- The immediate resistance level is seen at 157.88; the critical support level to watch is at 157.20.

The EUR/JPY cross has a volatile session during the early Asian session on Friday. The cross bounces off the weekly low of 157.00 area and currently trades around 157.65, gaining 0.06% on the day. The Japanese Yen (JPY) weakened against the Euro (EUR) following the release of Japan’s Gross Domestic Product (GDP) for the second quarter.
The Japanese Cabinet Office reported on Friday that the country’s Gross Domestic Product (GDP) for Q2 came in at 1.2% QoQ from the previous reading of 1.5% and below expectations of 1.3%. The annual growth number was 4.8% compared to 6% in the previous reading and missed the market consensus of 5.5%. Additionally, the Gross Domestic Product Deflator Q2 came in at 3.5% YoY from the previous reading of 3.4%. Finally, the Japanese Labor Cash Earnings for July increased by 1.3% YoY compared to 2.2% in June.
On Thursday, Bank of Japan (BoJ) policymaker Junko Nakagawa stated that it is appropriate to maintain an easy monetary policy for the time being. It's worth noting that the monetary policy divergence between the US and Japan might cap the upside of the Japanese Yen and act as a tailwind for EUR/JPY for the time being.
According to the one-hour chart, EUR/JPY holds below the 50- and 100-hour Exponential Moving Averages (EMAs) with a downward slope, which means further downside looks favorable. Meanwhile, the Relative Strength Index (RSI) stands below 50, within bearish territory, suggesting that sellers will likely retain control soon.
Therefore, the cross could meet the immediate resistance level near the 50-hour EMA at 157.88. The key barrier to watch is located at 158.00, representing a confluence of the 100-hour EMA, the upper boundary of the Bollinger Band, and a psychological round mark. A break above the latter will see a rally to 158.50 (a high of September 6).
On the downside, the critical support level to watch is near the lower limit of the Bollinger Band and a low of August 25 at 157.20. Any extended weakness below the latter will see a drop to a psychological round figure at 157.00. Further south, the cross will see the next downside stop at 156.35 (a low of August 8) and finally at 155.80 (a low of August 7).
EUR/JPY one-hour chart
Author

Lallalit Srijandorn
FXStreet
Lallalit Srijandorn is a Parisian at heart. She has lived in France since 2019 and now becomes a digital entrepreneur based in Paris and Bangkok.


