|

EUR/JPY Price Analysis: Pair finally broke down below support and fell towards 163.00.

  • EUR/JPY sank on Friday to near 163.10 after a 0.72% decline on the day.
  • Pair's price action plunged to 163.00 after facing rejection at the 164.00 SMA.
  • The MACD and RSI technical indicators signaled increasing selling pressure, contributing to the pair's downtrend.

The EUR/JPY currency pair witnessed a significant decline on Friday, losing 0.72% to reach a low of 163.10. Prior to this drop, the pair faced resistance at the 164.00 Simple Moving Average (SMA), which contributed to its downward movement.

The technical indicators employed in this analysis, namely the Moving Average Convergence Divergence (MACD) and Relative Strength Index (RSI), further underscore the bearish sentiment surrounding the EUR/JPY pair. The MACD histogram's red coloration and increasing size point to rising selling pressure, corroborated by the MACD line's position below the signal line. The RSI, with a value of 43, resides in negative territory and exhibits a sharply declining slope, indicating an increase in selling pressure.

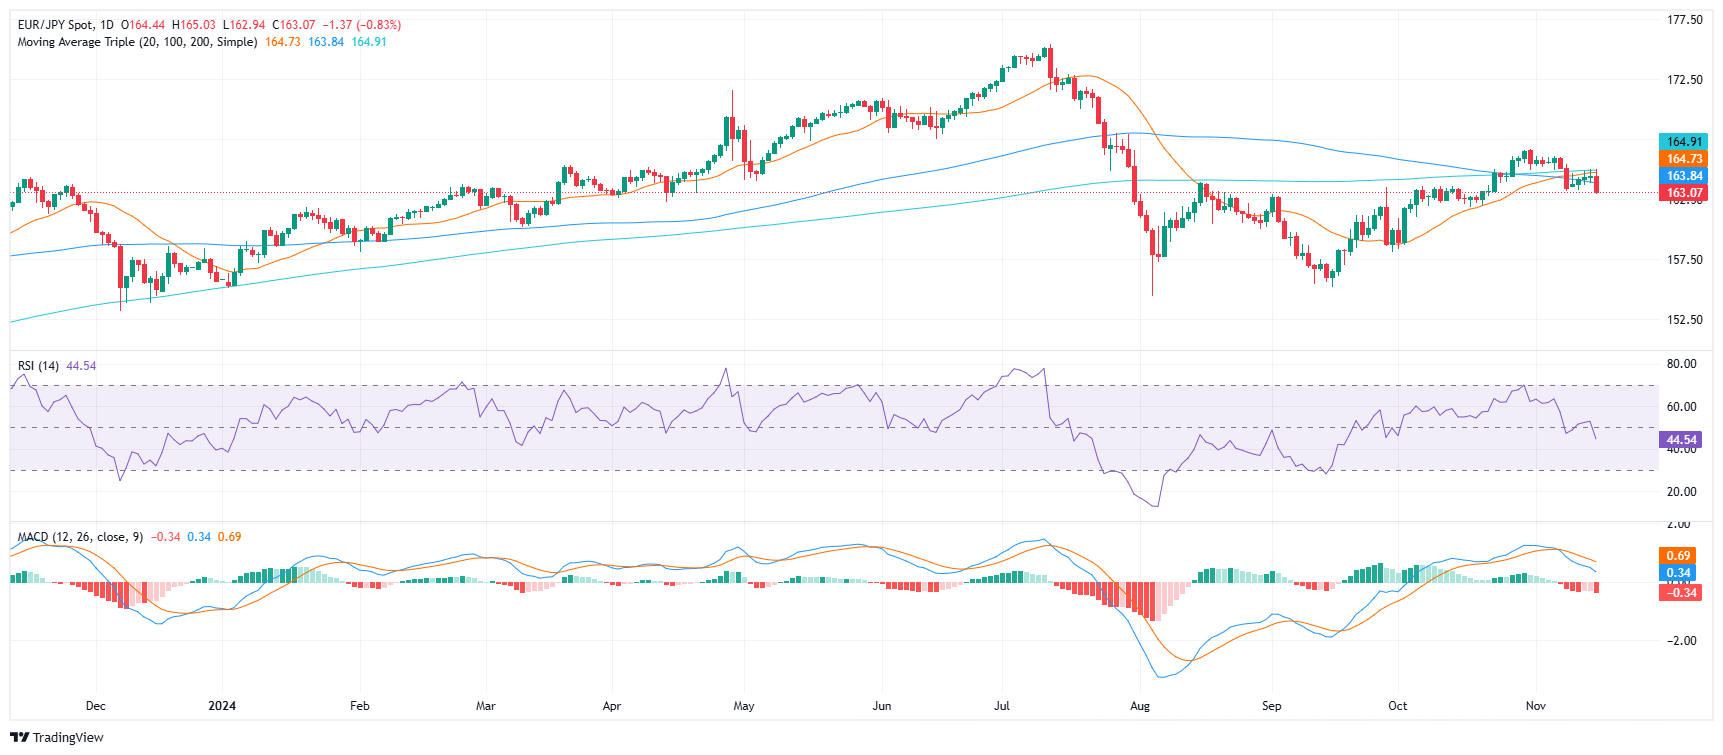
The pair's probable continuation of its downward trajectory is suggested by its trading below the 163.50 resistance level. Furthermore, support levels at 163.00, 162.50, and 162.00 deserve attention, while resistance levels at 164.00, 164.50, and 165.00 warrant monitoring.

EUR/JPY daily chart

Author

Patricio Martín

Patricio is an economist from Argentina passionate about global finance and understanding the daily movements of the markets.

More from Patricio Martín
Share:

Markets move fast. We move first.

Orange Juice Newsletter brings you expert driven insights - not headlines. Every day on your inbox.

By subscribing you agree to our Terms and conditions.

Editor's Picks

EUR/USD tests 1.1800, closes in on a fresh two-month high

EUR/USD extends its gains for the second consecutive day on Tuesday and trades near 1.1800. The broad-based US Dollar weakness and a potential policy divergence between the European Central Bank and the Federal Reserve keep the bullish bias intact heading into the holiday season.

GBP/USD climbs above 1.3500 area, renews 11-week peak

GBP/USD extends its weekly rally and trades at its highest level since early October above 1.3500. The US Dollar remains under persistent bearish pressure heading into the Christmas break, while Pound traders largely brush off the latest interest rate cut from the Bank of England.

Gold approaches $4,500 as record-setting rally continues

Gold builds on Monday's impressive gains and advances toward $4,500, setting fresh record-highs along the way. Heightened geopolitical tensions, combined with the ongoing US Dollar (USD) selloff ahead of the Q3 GDP data, help XAU/USD preserve its bullish momentum.

US GDP expected to highlight steady growth in Q3

The United States Bureau of Economic Analysis (BEA) will publish the first preliminary estimate of the third-quarter Gross Domestic Product on Tuesday, at 13:30 GMT. Analysts expect the data to show annualized growth of 3.2%, following the 3.8% expansion in the previous quarter.

Ten questions that matter going into 2026

2026 may be less about a neat “base case” and more about a regime shift—the market can reprice what matters most (growth, inflation, fiscal, geopolitics, concentration). The biggest trap is false comfort: the same trades can look defensive… right up until they become crowded.

XRP steadies above $1.90 support as fund inflows and retail demand rise

Ripple (XRP) is stable above support at $1.90 at the time of writing on Monday, after several attempts to break above the $2.00 hurdle failed to materialize last week. Meanwhile, institutional interest in the cross-border remittance token has remained steady.