|

EUR/JPY Price Analysis: Hits 4-day low belowC158.00 on bearish-engulfing pattern

  • EUR/JPY dips to 157.03, influenced by the restrictive policy stance of major global central banks.
  • The cross is bearish after failing to cling to the 158.00 figure.
  • The EUR/JPY could rally and test 157.55/60, before resuming its downtrend.

EUR/JPY dropped to a new four-day low of 157.03 on Thursday, courtesy of risk-aversion, after major global central banks decided to hold rates unchanged but kept their restrictive policy stance, led by the Federal Reserve and the Bank of England. At the time of writing, the pair exchanges hands at 157.27, losses a minuscule 0.07%, as Friday's Asian session begins.

The EUR/JPY daily chart portrays the pair as neutral-biased, though tilted to the downside. Failure to cling to the 158.00 mark exacerbated the cross fall, clearing crucial support levels, like the Kijun and Tenkan-Sen levels, each at 158.17 and 157.64. Nevertheless, bears must drag prices below the latest two swing lows, September 14 and 11, each at 156.64 and 156.58, respectively. At that point, the pair could extend its losses toward the bottom of the Ichimoku Cloud (Kumo) at 154.50.

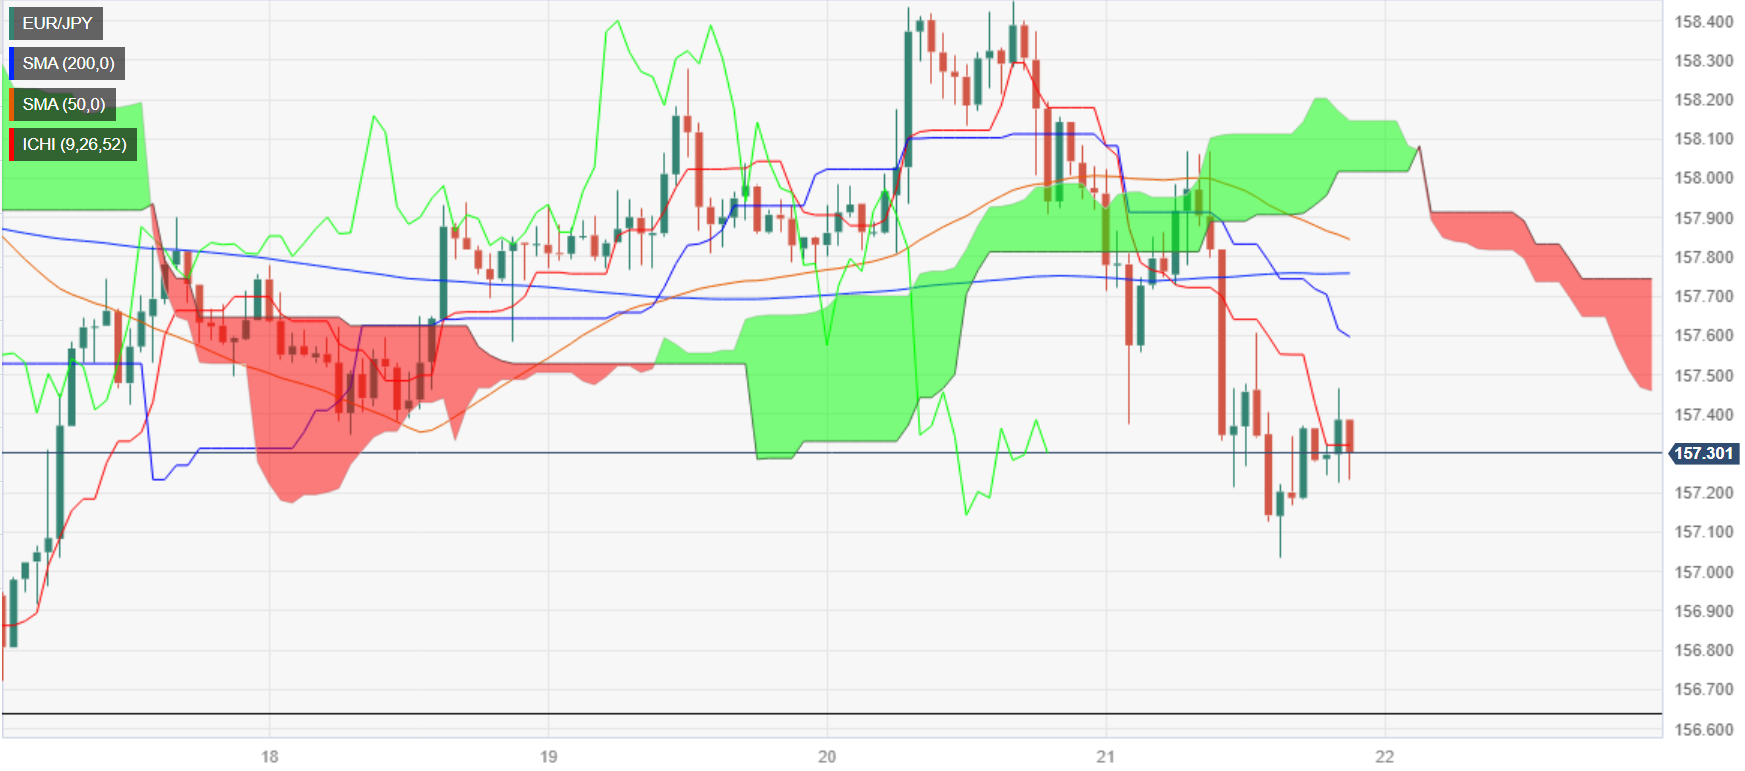
Short-term, the EUR/JPY is downward biased, with price action in the hourly chart standing below the Kumo, while the Tenkan and Kijun-Sen are in a bearish, orderly way. Nonetheless, the cross is set for an upward correction towards the confluence of the Kijun-Sen and the 50% Fibonacci retracement at around 157.55/60. After that, the cross-currency pair's first support would be the Tenkan-Sen at 157.28, followed by the 157.00 figure, ahead of dropping towards 156.50.

EUR/JPY Price Action – Hourly chart

EUR/JPY Key Technical Levels

EUR/JPY

Overview
Today last price157.29
Today Daily Change-0.85
Today Daily Change %-0.54
Today daily open158.14
 
Trends
Daily SMA20158.06
Daily SMA50157.41
Daily SMA100154.73
Daily SMA200148.95
 
Levels
Previous Daily High158.45
Previous Daily Low157.77
Previous Weekly High158.66
Previous Weekly Low156.58
Previous Monthly High159.76
Previous Monthly Low155.53
Daily Fibonacci 38.2%158.19
Daily Fibonacci 61.8%158.03
Daily Pivot Point S1157.79
Daily Pivot Point S2157.44
Daily Pivot Point S3157.11
Daily Pivot Point R1158.47
Daily Pivot Point R2158.8
Daily Pivot Point R3159.15

Author

Christian Borjon Valencia

Christian Borjon began his career as a retail trader in 2010, mainly focused on technical analysis and strategies around it. He started as a swing trader, as he used to work in another industry unrelated to the financial markets.

More from Christian Borjon Valencia
Share:

Markets move fast. We move first.

Orange Juice Newsletter brings you expert driven insights - not headlines. Every day on your inbox.

By subscribing you agree to our Terms and conditions.

Editor's Picks

EUR/USD moves sideways below 1.1800 on Christmas Eve

EUR/USD struggles to find direction and trades in a narrow channel below 1.1800 after posting gains for two consecutive days. Bond and stock markets in the US will open at the usual time and close early on Christmas Eve, allowing the trading action to remain subdued. 

GBP/USD keeps range around 1.3500 amid quiet markets

GBP/USD keeps its range trade intact at around 1.3500 on Wednesday. The Pound Sterling holds the upper hand over the US Dollar amid pre-Christmas light trading as traders move to the sidelines heading into the holiday season. 

Gold retreats from record highs, trades below $4,500

Gold retreats after setting a new record-high above $4,520 earlier in the day and trades in a tight range below $4,500 as trading volumes thin out ahead of the Christmas break. The US Dollar selling bias remains unabated on the back of dovish Fed expectations, which continues to act as a tailwind for the bullion amid persistent geopolitical risks.

Bitcoin slips below $87,000 as ETF outflows intensify, whale participation declines

Bitcoin price continues to trade around $86,770 on Wednesday, after failing to break above the $90,000 resistance. US-listed spot ETFs record an outflow of $188.64 million on Tuesday, marking the fourth consecutive day of withdrawals.

Economic outlook 2026-2027 in advanced countries: Solidity test

After a year marked by global economic resilience and ending on a note of optimism, 2026 looks promising and could be a year of solid economic performance. In our baseline scenario, we expect most of the supportive factors at work in 2025 to continue to play a role in 2026.

Avalanche struggles near $12 as Grayscale files updated form for ETF

Avalanche trades close to $12 by press time on Wednesday, extending the nearly 2% drop from the previous day. Grayscale filed an updated form to convert its Avalanche-focused Trust into an ETF with the US Securities and Exchange Commission.